Monthly Archives: February 2017


What to watch for in PWR this weekend

This article looks at the most interesting outcomes of games this weekend, with a focus on what PWR might look like next Monday. If you want a more general analysis of the remaining regular season and NCAA tournament likelihood, check out the article, NCAA tournament outlook as conferences enter final regular season weekend, and the table, Wins needed to likely end regular season at PWR rank.

Biggest upside potential

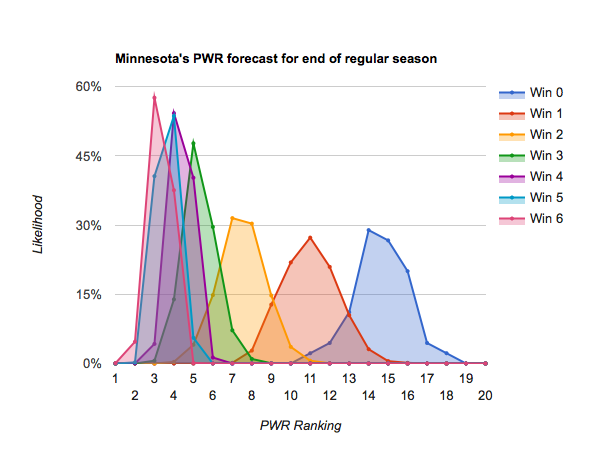
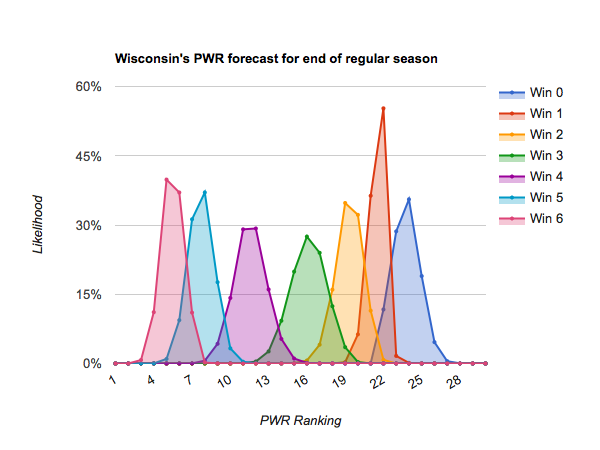
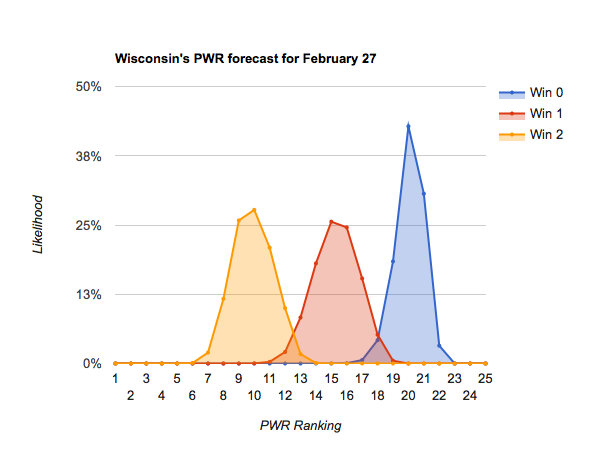
#20 Wisconsin, visiting the red hot #4 Gophers in Minneapolis, has an opportunity to surge. The Badgers could climb to the 9-11 range with a sweep (as high as 7 is realistic), but will likely just stay put if swept. Of course, in the long run staying put is not good enough for the Badgers who needs 3-4 wins in their final 6 games to climb to the bubble (see NCAA tournament outlook).

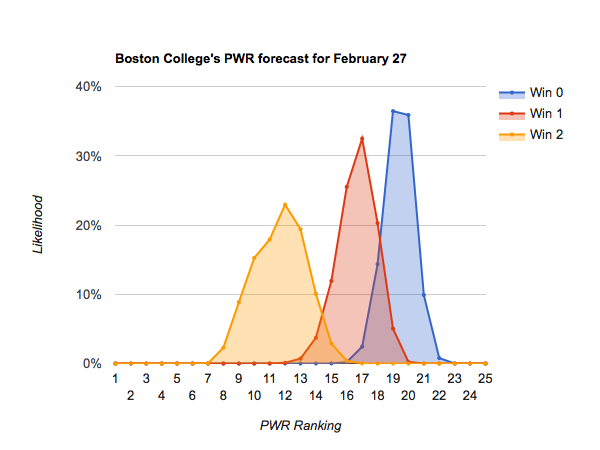
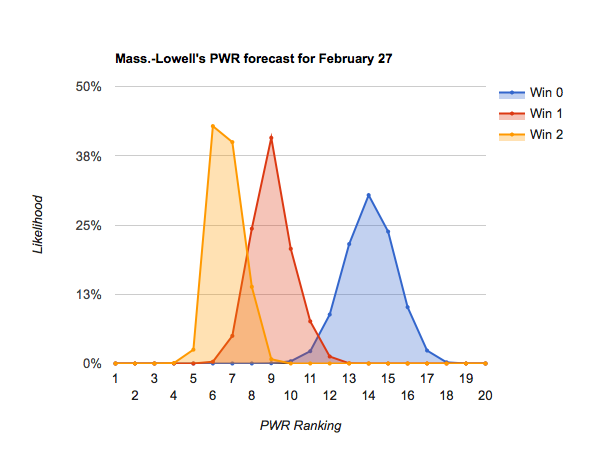
#18 Boston College has a similar opportunity facing #8 Mass.-Lowell for a home-and-home series. Sweeping would provide a broad range of possible outcomes, from #8-#15 quite possible. Getting swept would likely result in a modest decline to the 19-20 range.

Biggest downside potential

As past readers of these articles know, just as teams around #20 usually have the most upside potential, teams around #10 usually have the most potential to fall.

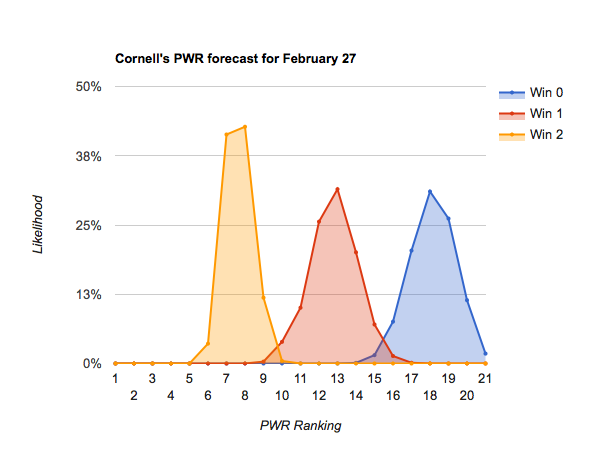
#10 Cornell faces the most downside potential, with ranks 15-21 possible if swept by Rensselaer and Union. Given that these are the last two games of the regular season for Cornell, that would put the Big Red firmly on the bubble.

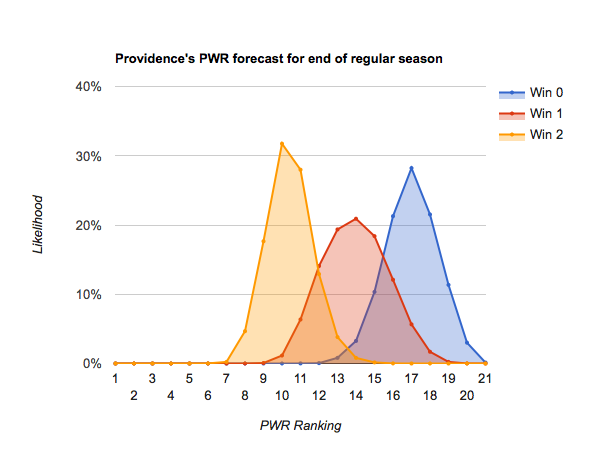
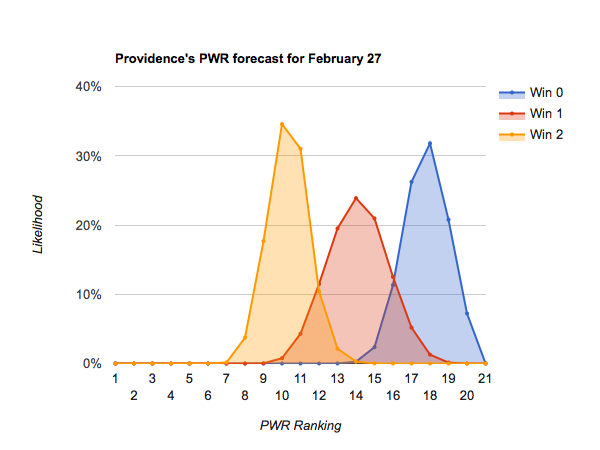
#9 Providence faces a similar outlook, with ranks 15-20 possible with a pair of losses to Massachusetts.

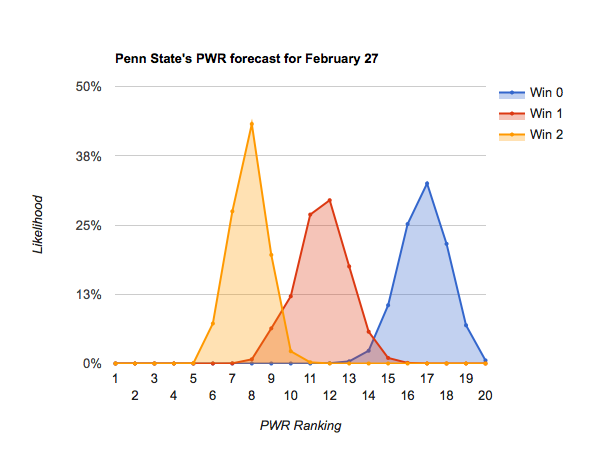
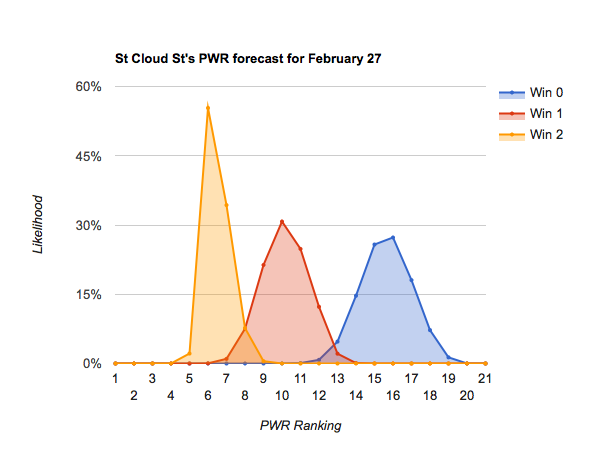
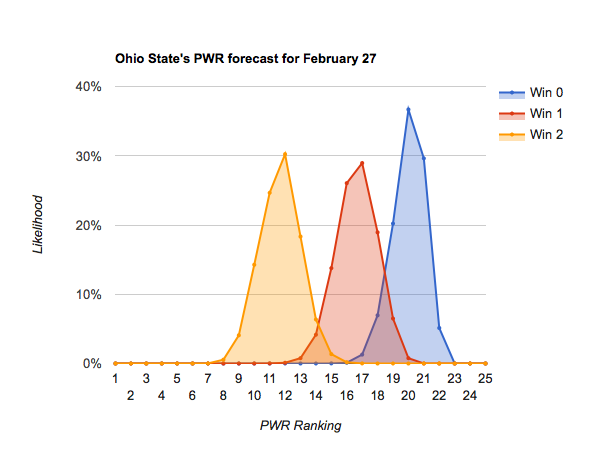
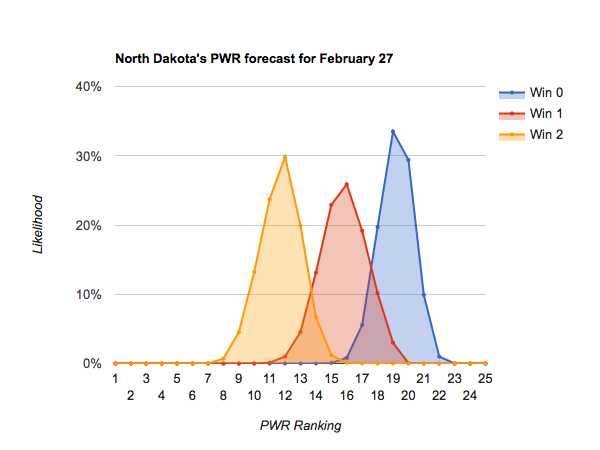
All of #8 Mass.-Lowell, #11 Penn State, #12 St Cloud St, #13 Ohio St, and #14 North Dakota face similar chances of a slightly more modest plunge with a pair of losses. Only Mass.-Lowell’s regular season ends this weekend, so others would have some opportunity to recover.

Top seeds?

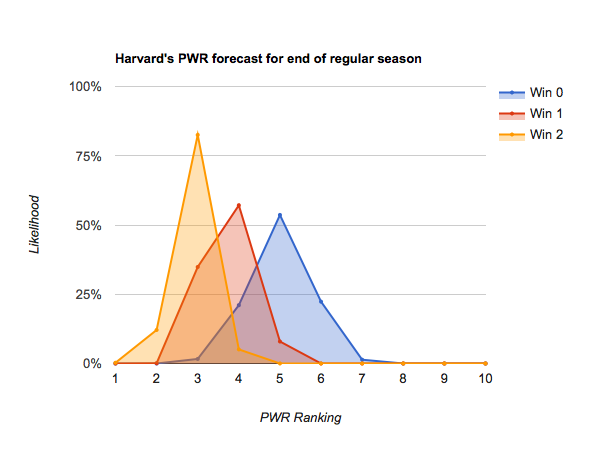
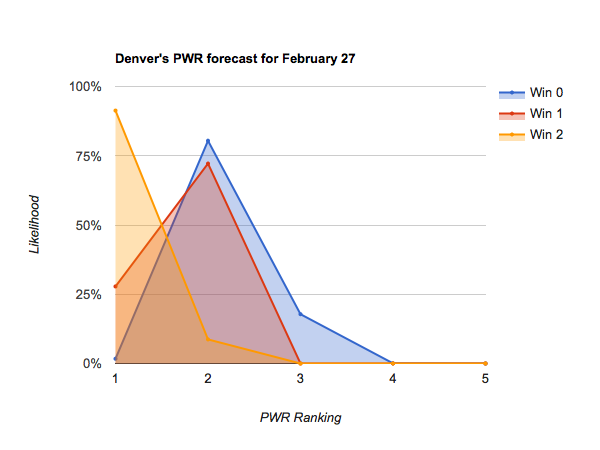
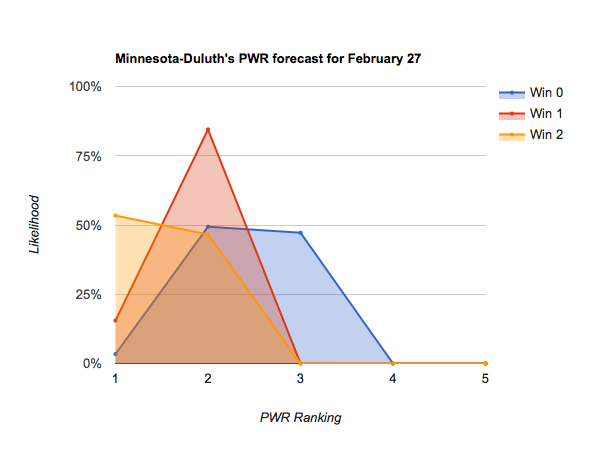
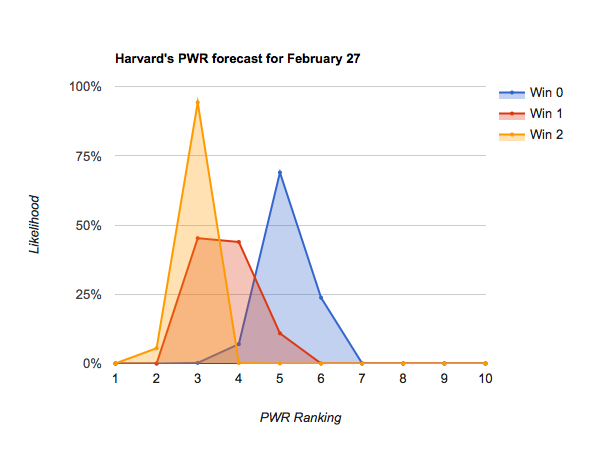
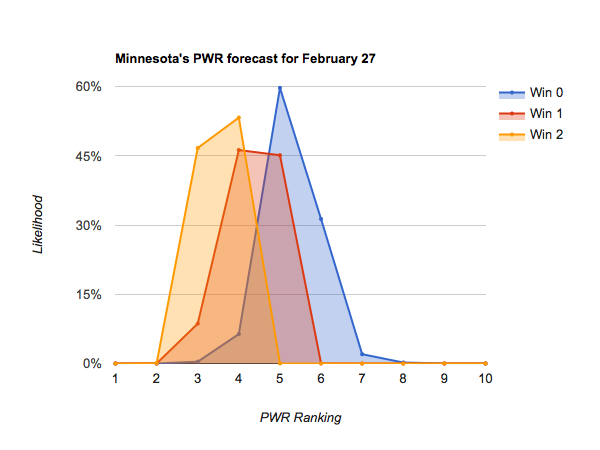
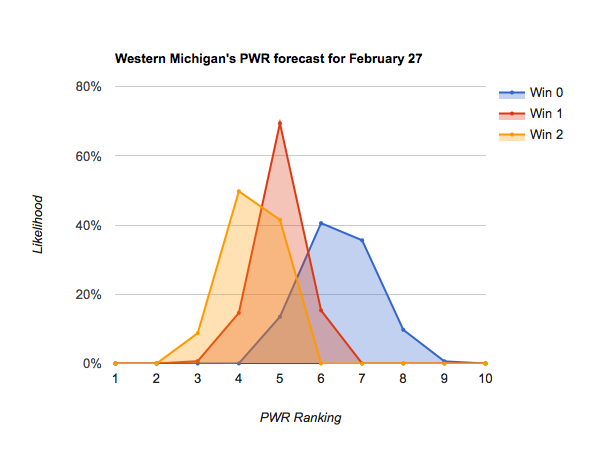
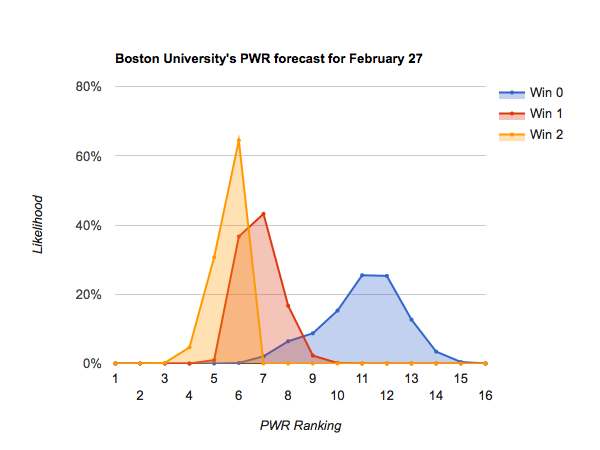
#1 Denver and #2 Minnesota-Duluth each look unlikely to leave the weekend outside of the 1-3 range, regardless of outcome, and one of the two is almost certain to come out #1. Denver doesn’t quite control its own destiny, as Minnesota-Duluth stands about a 10% chance of sneaking into #1 even if both sweep. Other teams fighting for spots in the top 4 this weekend are #3 Harvard, #4 Minnesota, #5 Western Michigan, and #6 Boston University.

Methodology

Forecasts include the results of games played through Tuesday of this week.

Each forecast is based on at least one million monte carlo simulations of the games in the described period. For each simulation, the PairWise Ranking (PWR) is calculated and the results tallied. The probabilities presented in the forecasts are the share of simulations in which a particular outcome occurred.

The outcome of each game in each simulation is determined by random draw, with the probability of victory for each team set by their relative KRACH ratings. So, if the simulation set included a contest between team A with KRACH 300 and team B with KRACH 100, team A will win the game in very close to 75% of the simulations. I don’t simulate ties or home ice advantage.

Resources

NCAA tournament outlook as conferences enter final regular season weekend

Despite being down to the last full weekend of conference play (two remain for the Big Ten and one for the NCHC), the outlook hasn’t changed much since last week’s article.

You may want to follow along with the data, this narrative is all based on the forecast of PWR by wins, which shows the number of wins necessary to be likely to end the regular season at a particular PWR ranking.

Keep in mind that conference tournaments could result in additional movements, though by then we generally know that teams in the mid-teens need to win to get an at-large bid.

Near locks

With a lossless weekend, the top three teams solidified their positions. It’s now probably pretty safe to add #3 Harvard to the list of near locks. Even with two losses this weekend, the Crimson are unlikely to fall below the the 3-6 range, so would still likely get an at-large bid even in the worst case 0-2 conference tournament scenario. Note that’s not yet a mathematical certainty, just quite likely.

#1 Denver
#2 Minnesota-Duluth
#3 Harvard

Likely in unless they collapse

Note that despite a sweep last weekend, I’m still nowhere near ready to call it for #4 Minnesota. The Gophers have six regular season games remaining and could easily plummet to the bubble if they lose them all. That’s probably not likely, but certainly possible.

Down to about #8 Mass-Lowell will be well positioned with just a single additional win. Note that many of those teams only have two regular season games remaining, so going winless is quite possible.

Note also that I dropped #9 Providence from this list after a loss and tie last weekend were the potential first step in the very type of collapse that could land the Friars on the bubble.

#4 Minnesota
#5 Western Michigan
#6 Boston University
#7 Union
#8 Mass.-Lowell

Control their own fate

#9 Providence is still in control of its own destiny. Two wins this weekend would likely put them in the 8-12 range, and in control of their own fate.

That holds true down to about #20 Wisconsin, which can still move into a top 10 spot with 5-6 wins in its final 6 games.

Note, however, that #17 Vermont is in a precarious position. While two wins is most likely to push the Catamounts up to around #14, there’s a reasonable chance of staying as low as #17.

#9 Providence
#10 Cornell
#11 Penn State
#12 St Cloud St
#13 Ohio State
#14 North Dakota
#15 Air Force
#16 Notre Dame
#17 Vermont
#18 Boston College
#19 Nebraska-Omaha
#20 Wisconsin

Need to do well in conference tournaments

Some of #21 Northeastern and below stand a chance of climbing to the bubble by the end of the regular season, but that alone won’t be enough to make the NCAA tournament. Some additional wins in the conference tournament or extremely good luck will be required to make the NCAAs at-large.

#28 Miami’s chances faded significantly with a pair of losses last weekend, but having two more games remaining than other teams in the 20s gives them one of the best chances at climbing back.

#21 Northeastern
#22 St. Lawrence
#23 Quinnipiac
#24 Bemidji St
#25 Clarkson
#26 Canisius
#27 MSU-Mankato
#28 Miami
#29 Merrimack
#30 Robert Morris
#31 Michigan Tech
#32 Army
#33 Yale
#34 Princeton
#35 Connecticut
#36 Colorado College
#37 New Hampshire
#38 Dartmouth
#39 Bentley
#40 Holy Cross
#41 Bowling Green
#42 Michigan
#43 Maine
#44 Arizona St
#45 Sacred Heart
#46 Mercyhurst
#47 Colgate
#48 Lake Superior St
#49 RIT
#50 Michigan St
#51 Ferris St
#52 Northern Michigan
#53 Alaska
#54 Alaska-Anchorage
#55 American Int’l
#56 Alabama-Huntsville
#57 Rensselaer
#58 Massachusetts
#59 Brown
#60 Niagara

Methodology

Forecasts include the results of games played through Thursday of this week.

Each forecast is based on at least one million monte carlo simulations of the games in the described period. For each simulation, the PairWise Ranking (PWR) is calculated and the results tallied. The probabilities presented in the forecasts are the share of simulations in which a particular outcome occurred.

The outcome of each game in each simulation is determined by random draw, with the probability of victory for each team set by their relative KRACH ratings. So, if the simulation set included a contest between team A with KRACH 300 and team B with KRACH 100, team A will win the game in very close to 75% of the simulations. I don’t simulate ties or home ice advantage.

Resources

How many teams will each conference put in the playoffs? (2017 edition)

In the college hockey community, speculation about who is likely to make the NCAA tournament begins to reach a fevered pitch this time of year. That also leads to inevitable boasting from fans of those conferences having a strong season.

Looking at the top 14 (or 16) of PWR gives an interesting benchmark of performance to date, but this is a situation in which it can be interesting to try to determine the effects of the known remaining regular season schedule. By simulating the rest of the regular season (assuming teams will continue to perform as they have to date), we can see how each conference is likely to fare at the end of the regular season.

How many teams will each conference put in the playoffs?

As mentioned above, a good quick first check is how many teams each conference currently has in the top 14. (The cut line of 14 is based on a historical guess, but also fits quite well with the current situation of two conferences with autobids not having any teams in the top 14).

Teams currently in the top 14 of PWR
Atlantic Hockey 0
Big Ten 3
ECAC 3
Hockey East 3
NCHC 5
WCHA 0

But, by simulating the rest of the regular season (assuming teams will continue to perform as they have to date), we can see how the remaining schedule might affect those numbers.

Likelihood of each conference’s number of teams in top 14 PWR at the end of the regular season
0 1 2 3 4 5 6
Atlantic Hockey 41% 59%
Big Ten 2% 35% 57% 6%
ECAC 9% 91%
Hockey East 2% 37% 48% 13% 1%
NCHC 21% 50% 29% 1%
WCHA 100%

Comparing the two tables, Atlantic Hockey and Hockey East are more likely to make a small gain before the end of the regular season than stay at their current level. That’s not surprising, as Atlantic Hockey and Hockey East teams currently hold PWR spots 15 and 16-18, respectively. The NCHC is more likely than not to lose a team, with St Cloud St and North Dakota sitting at #12 and #14, respectively. In fact, the NCHC seems about as likely to end with just 3 teams in the top 14 as its current 5. The Big Ten, with teams in PWR spots 11 and 13, is also reasonably likely to lose a team.

Methodology

Forecasts include the results of games played through Tuesday of this week.

Each forecast is based on at least one million monte carlo simulations of the games in the described period. For each simulation, the PairWise Ranking (PWR) is calculated and the results tallied. The probabilities presented in the forecasts are the share of simulations in which a particular outcome occurred.

The outcome of each game in each simulation is determined by random draw, with the probability of victory for each team set by their relative KRACH ratings. So, if the simulation set included a contest between team A with KRACH 300 and team B with KRACH 100, team A will win the game in very close to 75% of the simulations. I don’t simulate ties or home ice advantage.

Resources

NCAA field shaping up with three weeks left in regular season

With three weekends of left of regular season play for most conferences (the Big Ten has four), the field of who is likely to make the NCAA tournament has really shaped up in the last week.

You may want to follow along with the data, this narrative is all based on the forecast of PWR by wins, which shows the number of wins necessary to be likely to end the regular season at a particular PWR ranking.

Keep in mind that conference tournaments could result in additional movements, though by then we generally know that teams in the mid-teens need to win to get an at-large bid.

Near locks

Only the top two, #1 Minnesota-Duluth and #2 Denver actually seem to be locks regardless of outcomes. Neither is likely to fall below the #4-7 range, even if swept, so would likely still get an at-large bid even in the worst case 0-2 scenario in the subsequent conference tournament. Note that’s not yet a mathematical certainty, just quite likely.

#1 Minnesota Duluth
#2 Denver

Likely in unless they collapse

#3 Harvard through #9 Mass.-Lowell need at least one win to be likely to finish in the top 13, and thus well positioned for a tournament spot. Because there is an extra weekend of Big Ten play remaining, #4 Minnesota and #6 Penn State actually 3-4 wins to be well positioned for a tournament spot.

#3 Harvard
#4 Minnesota
#5 Boston University
#6 Penn State
#7 Western Michigan
#8 Providence
#9 Mass.-Lowell

Control their own fate

#10 North Dakota through #21 Wisconsin plus #25 Miami control their own fate in reaching the NCAA tournament. #10 North Dakota appears to need 3 wins in its remaining 6 games to be top 13 going into conference tournament play, while #20 Air Force needs to win out its final 4 to stand a decent chance of finishing the regular season in the top 13. #21 Wisconsin has much more room to move because of the extra weekend of Big Ten play remaining. #25 Miami is the lowest ranked team that still seems to control its own ability to jump onto the bubble, with a sweep out of 6 wins likely to land them in the 10-13 range to close out the regular season.

#10 North Dakota
#11 Union
#12 St Cloud St
#13 Cornell
#14 Ohio St
#15 Boston College
#16 Vermont
#17 Nebraska-Omaha
#18 Notre Dame
#19 St. Lawrence
#20 Air Force
#21 Wisconsin
#25 Miami

#22 Quinnipiac through #24 Bemidji State and #26 Canisius and below are unlikely to crack the top 15 in the regular season, so would need near perfection and some luck to sneak into position for an at-large bid. Then, continued success in the conference tournament would be required not to fall out of position. These teams should plan to do well in their conference tournaments.

#22 Quinnipiac
#23 Northeastern
#24 Bemidji State
#26 Canisius
#27 Clarkson
#28 Robert Morris
#29 Merrimack
#30 Princeton
#31 Michigan Tech
#32 MSU-Mankato
#33 Yale
#34 Connecticut
#35 Army
#36 New Hampshire
#37 Colorado College
#38 Dartmouth
#39 Holy Cross
#40 Bentley
#41 Michigan
#42 Bowling Green
#43 Maine
#44 Arizona State
#45 Colgate
#46 Sacred Heart
#47 Mercyhurst
#48 RIT
#49 Michigan State
#50 Lake Superior
#51 Northern Michigan
#52 Ferris State
#53 Alaska
#54 Alaska-Anchorage
#55 American Int’l
#56 Alabama-Huntsville
#57 Rensselaer
#58 Brown
#59 Massachusetts
#60 Niagara

Methodology

Forecasts include the results of games played through Thursday of this week.

Each forecast is based on at least one million monte carlo simulations of the games in the described period. For each simulation, the PairWise Ranking (PWR) is calculated and the results tallied. The probabilities presented in the forecasts are the share of simulations in which a particular outcome occurred.

The outcome of each game in each simulation is determined by random draw, with the probability of victory for each team set by their relative KRACH ratings. So, if the simulation set included a contest between team A with KRACH 300 and team B with KRACH 100, team A will win the game in very close to 75% of the simulations. I don’t simulate ties or home ice advantage.

Resources