First, let’s review last weekend’s prognostications.
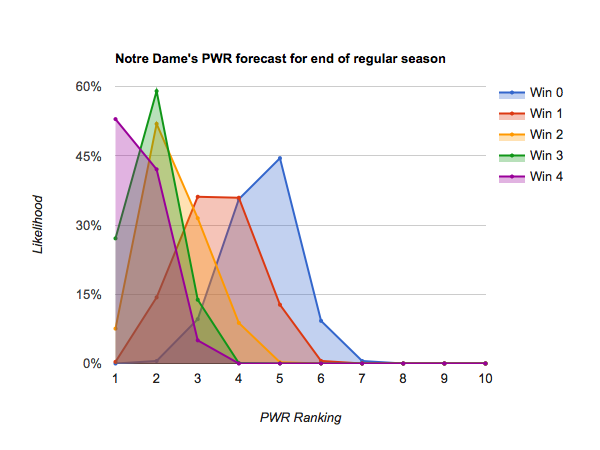
#1 St Cloud St didn’t need to sweep to hold onto the #1 spot because #2 Notre Dame stumbled with a pair of losses. Nonetheless, the Irish held onto #2 as predicted (#5 Denver could have overtaken them with a strong performance, but the Pioneers split on the weekend).
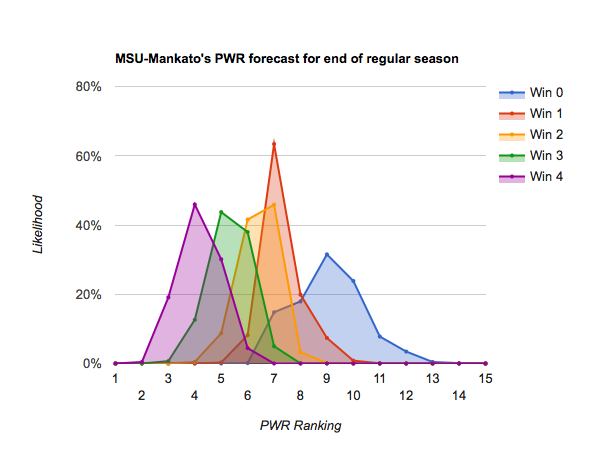
Those stumbles allowed #4 Mankato to climb into the top 4, as was noted could happen in that scenario.
None of the potential big movers came to fruition, as none pulled off the required sweeps.
Now, let’s look ahead to the coming weekend.
Potential 1 seeds
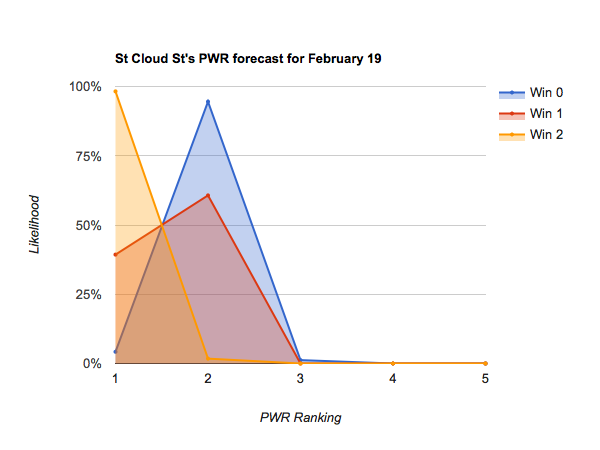
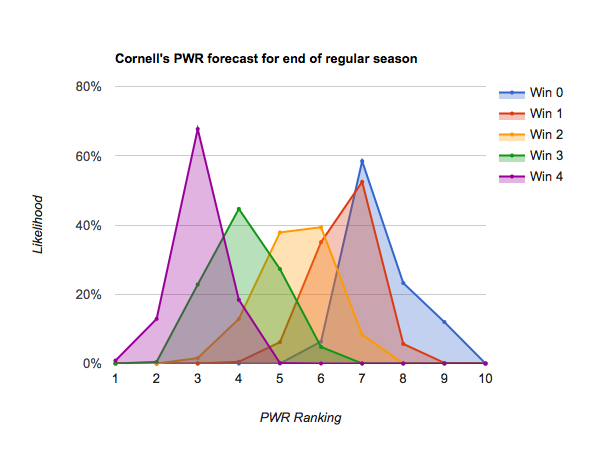
Because of stumbles by both St Cloud and Notre Dame last weekend, there are now 4 teams vying to emerge #1 from this weekend. In addition to the Huskies and Irish, #3 Cornell and #5 Denver stand a change of emerging from the weekend #1.
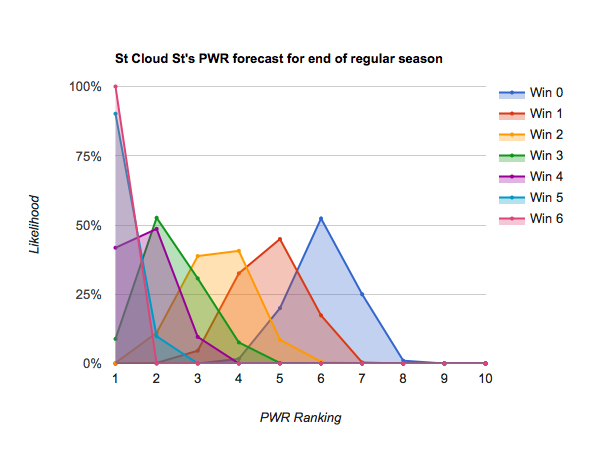
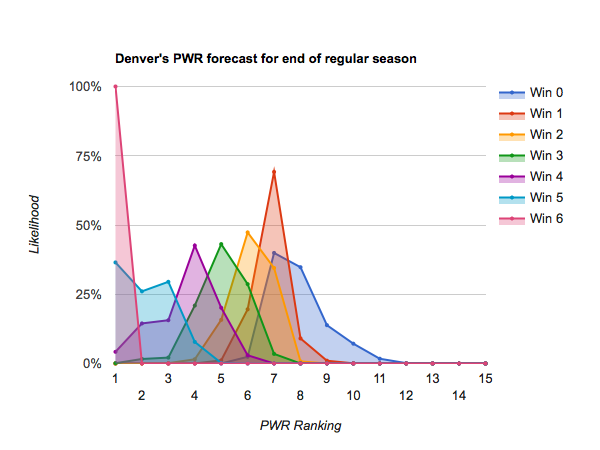
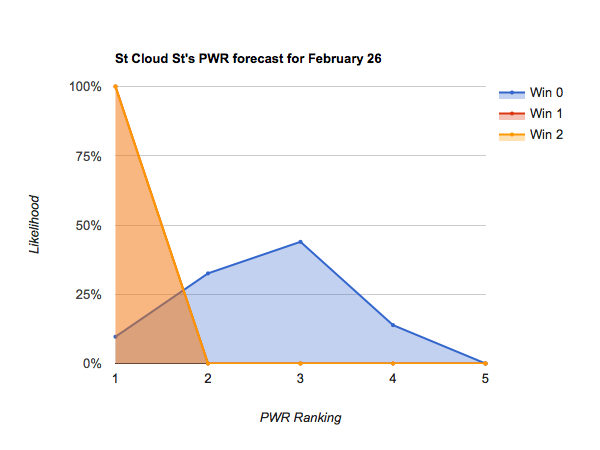
St Cloud is pretty much guaranteed to hold the #1 spot with a sweep of Denver. But, the same series gives Denver the best opportunity to take over the #1 spot if the Pioneers manage to pull off the sweep.

Above the bubble
Only the top 8 teams are pretty certain to emerge from the weekend in the top 12. Including those mentioned above, those teams are:
#1 St Cloud
#2 Notre Dame
#3 Cornell
#4 Minnesota State
#5 Denver
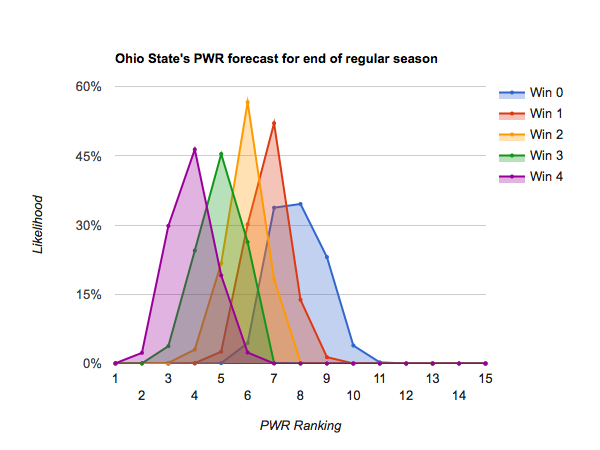
#6 Ohio State
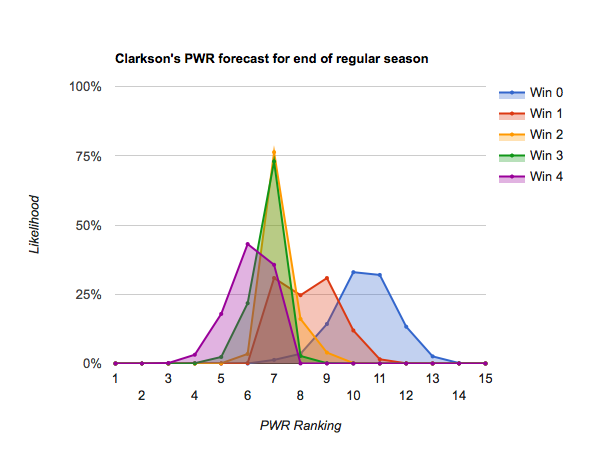
#7 Clarkson
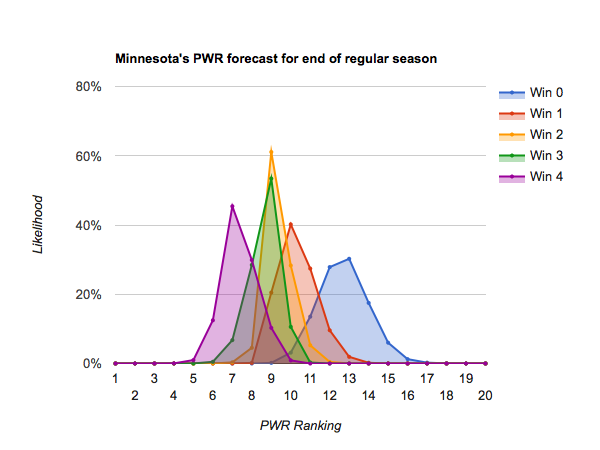
#8 Minnesota
It’s too early to call them all locks for the NCAA tournament (disaster in conference tournament play could easily push one of the bottom few onto the bubble), but they’ll be well positioned heading into the conference tournaments.
On the bubble
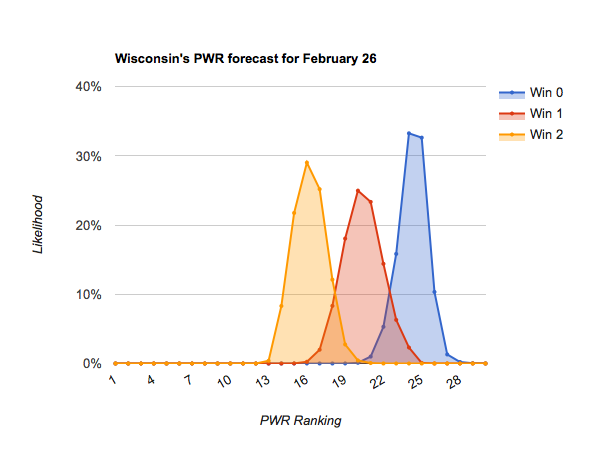
Almost all teams through #24 Wisconsin have a chance to emerge from the weekend in the top 14, thus on the bubble for an at-large bid for the NCAA tournament.
Those include:
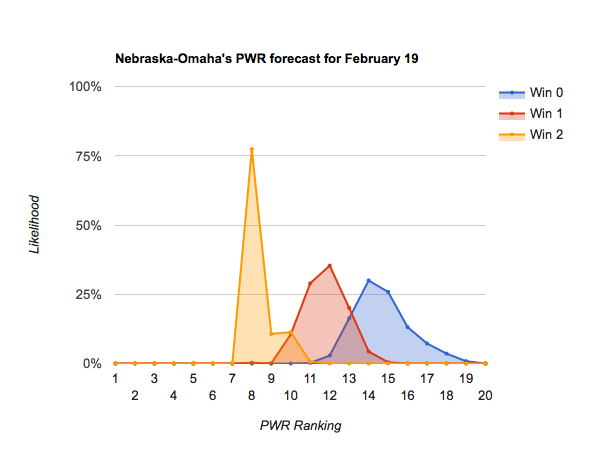
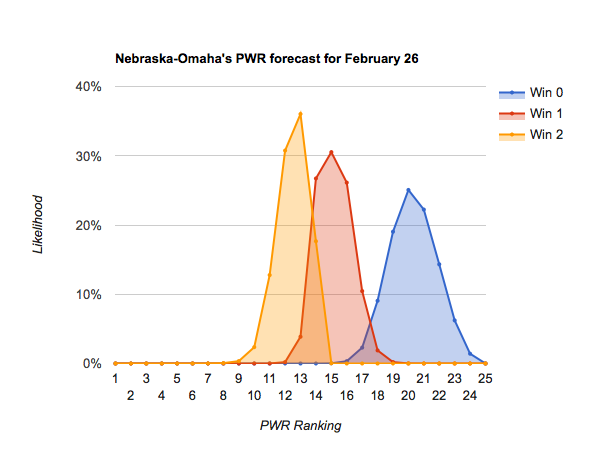
#14 Nebraska-Omaha
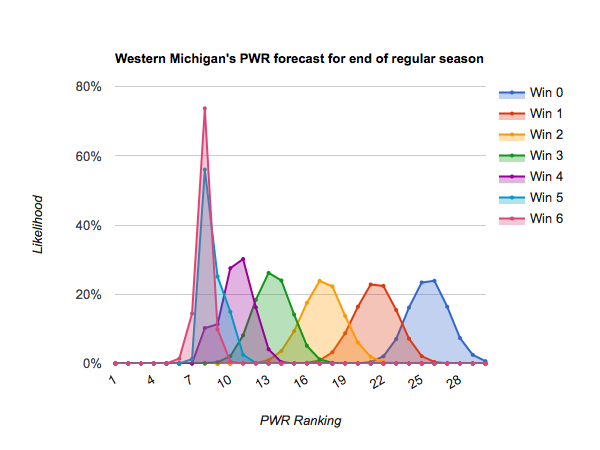
#15 Western Michigan
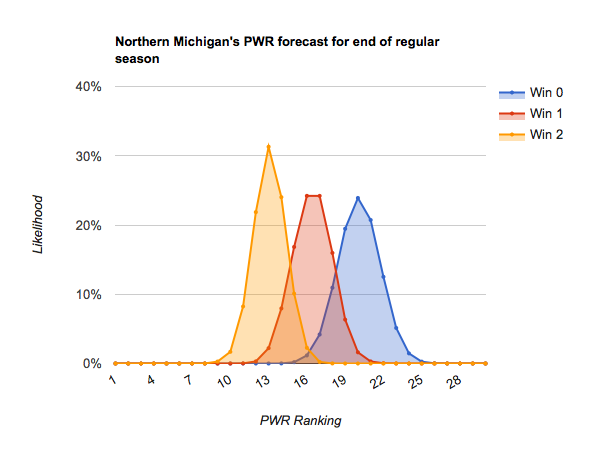
#16 Northern Michigan
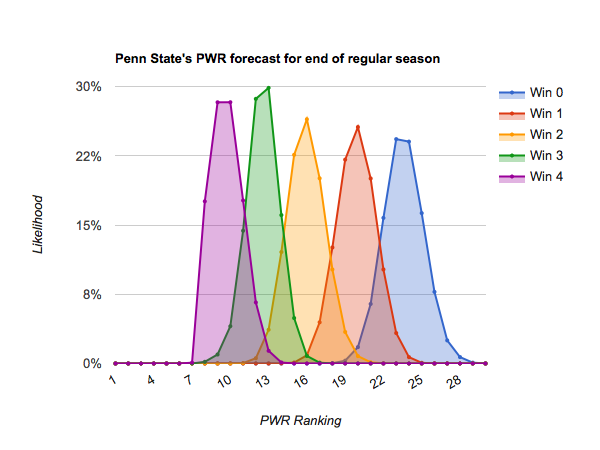
#17 Penn State
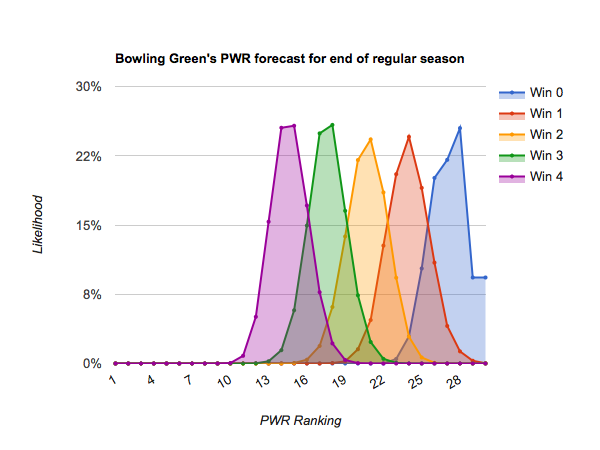
#18 Bowling Green
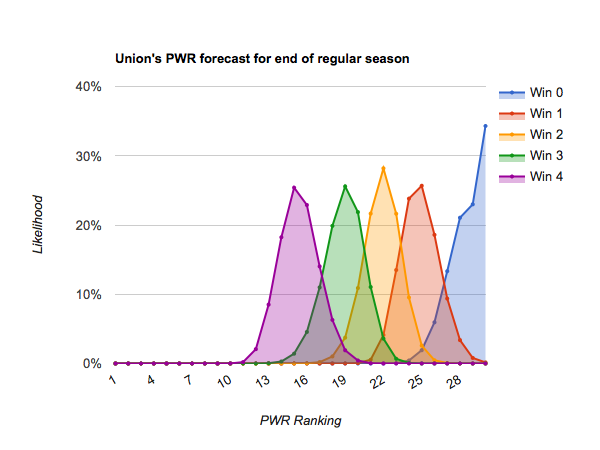
#20 Union
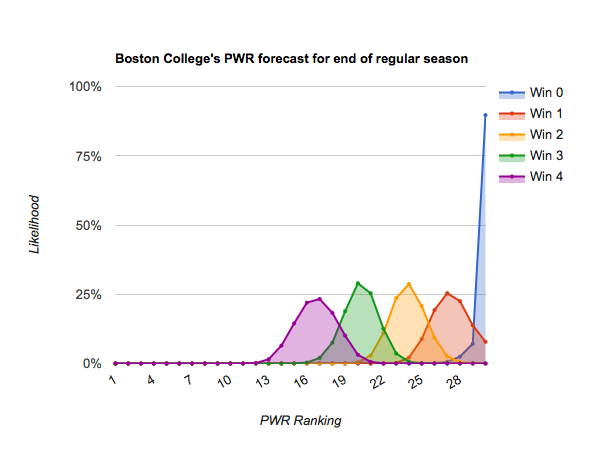
#21 Boston College
#22 Harvard
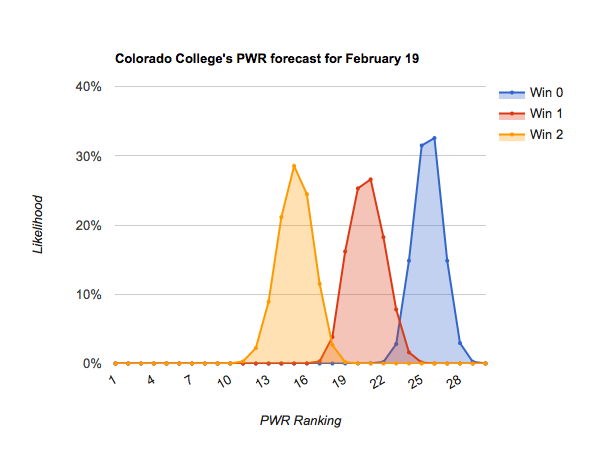
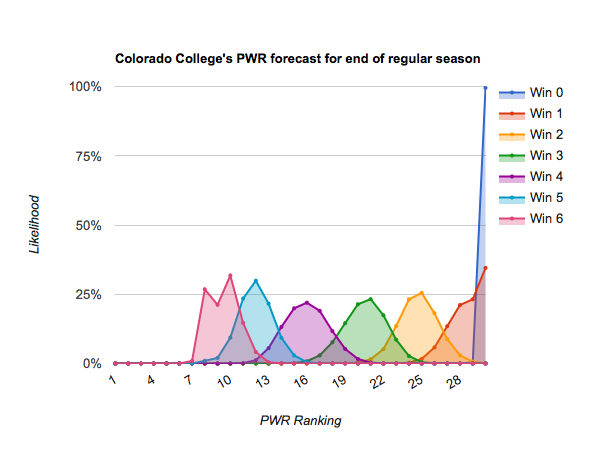
#23 Colorado College
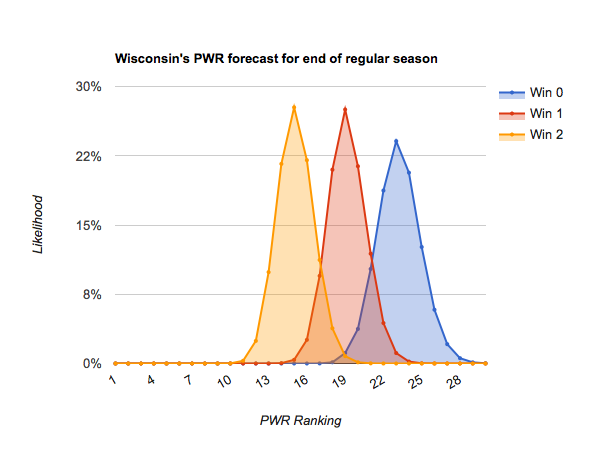
#24 Wisconsin
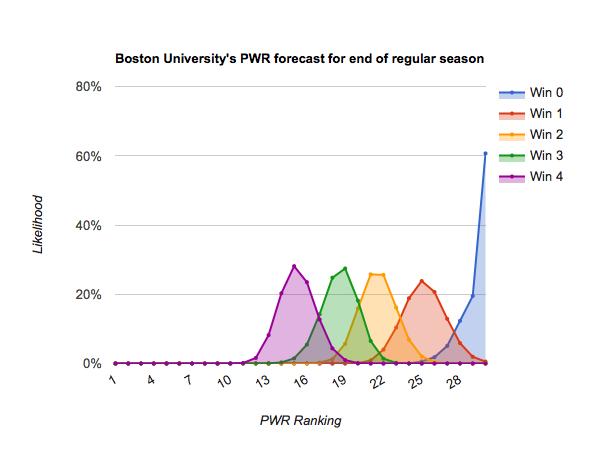
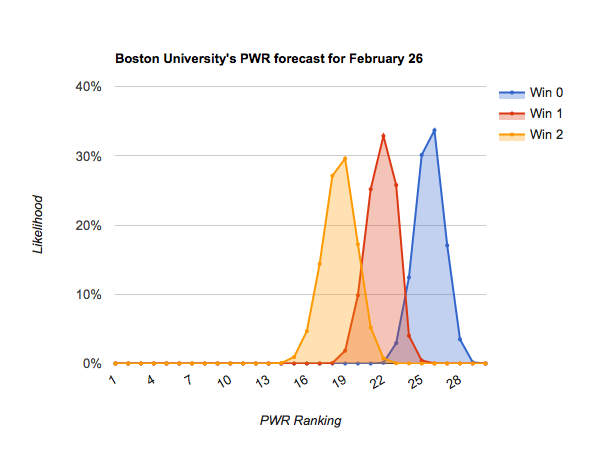
#19 Boston University is the one exception. Hosting a pair of games against #47 Vermont just doesn’t give the Terriers much upside, with #16 looking like the best likely weekend outcome (and even that isn’t very likely).
On the outside, looking in
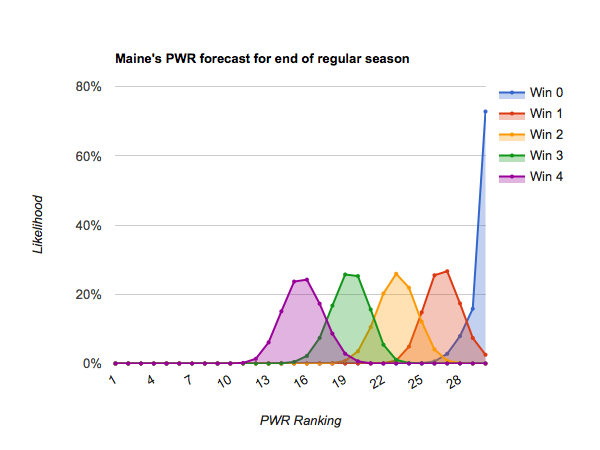
#25 Maine and below just aren’t very likely to climb onto the bubble, regardless of their performance this weekend. Those teams will be looking for success in their conference tournaments to gain access to the NCAA tournament.

Other interesting potential moves
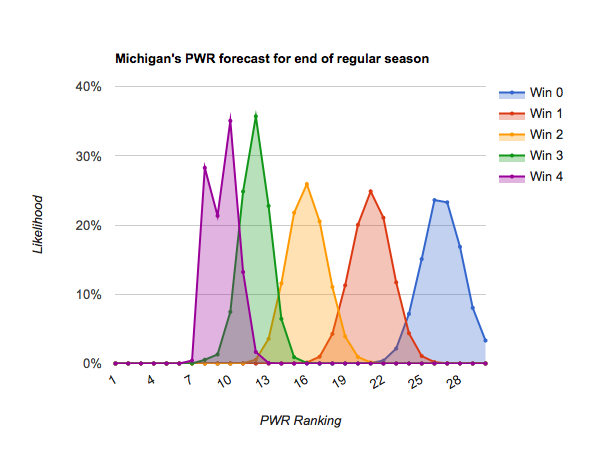
#11 Michigan is the highest ranking team facing a precipitous cliff. Getting swept by #55 Arizona St could push the Wolverines as low as #22, with the #17-19 range most likely. A sweep isn’t particularly helpful, with a #10-11 ranking the most likely outcome of a sweep.
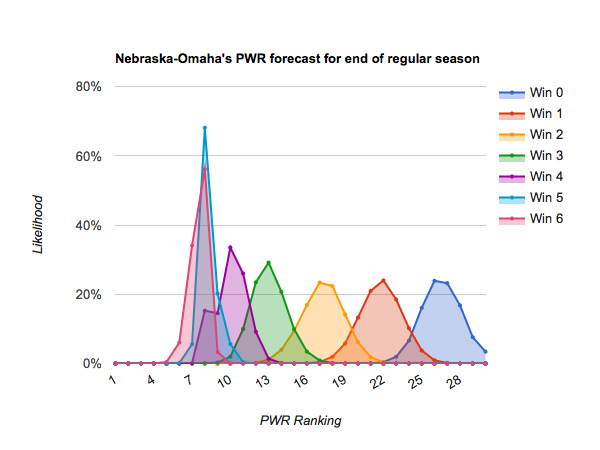
Perhaps more likely, #14 Nebraska-Omaha faces similar downside in a pair of games against #23 Colorado College. Getting swept could push the Mavericks as low as #24, though #19-21 are most likely. UNO, however, faces some upside potential from a sweep, with a climb to #11-12 most likely.
How it works
Each forecast is based on at least one million monte carlo simulations of the games in the described period. For each simulation, the PairWise Ranking (PWR) is calculated and the results tallied. The probabilities presented in the forecasts are the share of simulations in which a particular outcome occurred.
The outcome of each game in each simulation is determined by random draw, with the probability of victory for each team set by their relative KRACH ratings. So, if the simulation set included a contest between team A with KRACH 300 and team B with KRACH 100, team A will win the game in very close to 75% of the simulations. I don’t simulate ties or home ice advantage.
Resources
- PWR Rankings (CollegeHockeyRanked.com)
- Forecasted PWR by team wins (CollegeHockeyRanked.com)
- CHN PWR Rankings (CollegeHockeyNews.com)
- USCHO PWR Rankings (USCHO.com)
- Explanation of how PWR mimics NCAA tournament selection (CollegeHockeyNews.com)