Who doesn’t find themself looking at the PairWise Ranking (PWR) each week? (Ok, very few of us do, but I have a feeling you might be among the select few). While a lot of the tools and analysis here focus on the end of season and who’s going to make the NCAA tournament, it’s also sometimes fun to look at the week-to-week ebb and flow.
You can always use the PWR calculator to find out for yourself what would happen with just a few games’ results determined, e.g. what would St. Cloud St’s PWR be if its weekend results were already in. But, using the same simulations I use for end-of-season projections, focusing on just one week’s results, can provide a more nuanced answer to the same question. If the calculator tells you “what would St. Cloud St’s PWR be with nothing changed but this weekend’s results being set”, the simulations tell you “what is St. Cloud St’s PWR likely to be after all teams’ games this weekend are completed?” Got it?
One more programming note–it’s not uncommon to see teams in the 40s have one week upside potential in the range of 10 spots. Those generally require an improbable sweep of a much higher ranked team, and even if completed, don’t result in the team being anywhere near the bubble. I include a game as interesting only if it involves a team that has a notable chance of making the NCAAs at large.
Upside potential: #20 North Dakota
A stretch of tough competition provides PWR opportunities for #20 North Dakota. After the Fighting Hawks earned a much needed split against #1 St Cloud St last weekend, they are now at the bottom of a PWR hill going into a pair of games at #6 Denver this weekend. By the current rankings, UND “should” lose those road games at a ranked opponent, so any success will push the Hawks upward, while failure won’t result in much of a fall (though UND can’t afford to squander such an opportunity to climb at this point).
A pair of wins would most likely shoot UND into the #12-#16 range, with a break into the single digits unlikely, but mathematically possible. A split would most likely result in a modest climb to the #16-#19 range. Going into games you’re expected to lose results in very little downside risk, as even getting swept would likely leave the Hawks in the #19-#22 range.
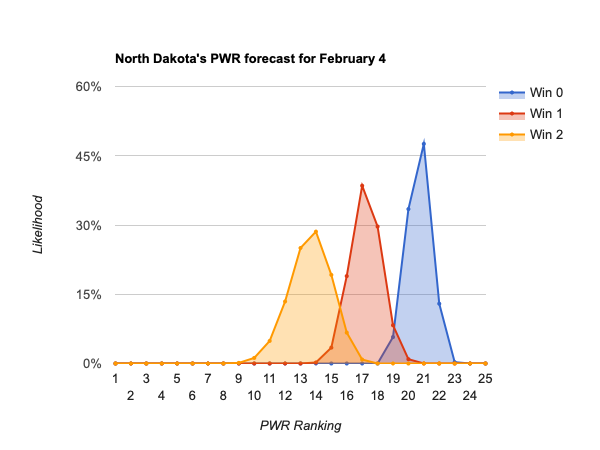
Using the PWR Calculator, you can see that if no other games were played this weekend, a pair of wins would land UND at #12, a split at #17, and a pair of losses at #20.
Downside potential: #10 Providence, #9 Cornell
#10 Providence faces the opposite situation from UND, hosting #39 Vermont for a pair of games this weekend. The Friars are at the most treacherous PWR ranking, where RPIs start to become pretty compressed, numerous PWR comparisons are won by 1, and your resume doesn’t really look that different from the team 10 spots below you. Providence is supposed to win; a sweep won’t help their ranking, but underperforming could result in a sharp fall.
A pair of wins would most likely keep Providence in the #9-#12 range. A split would likely result in a modest fall to the #12-#16 range. Getting swept in a pair of games the Friars are supposed to win could be catastrophic, most likely resulting in a PWR anywhere in the #14-#20 range.
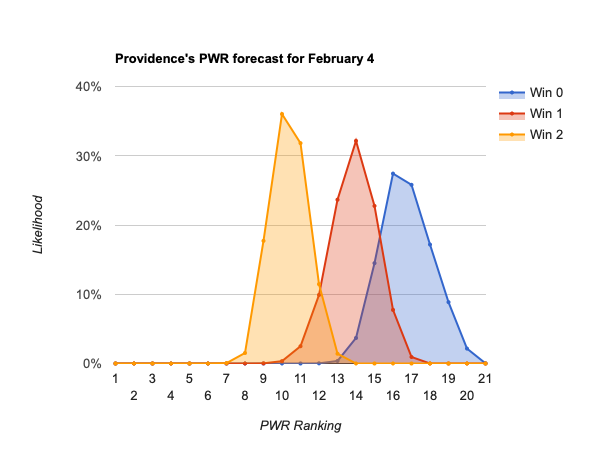
Using the PWR Calculator, you can see that if no other games were played this weekend, a pair of wins would land PC at #9, a split at #14, and a pair of losses at #17.
The narrative for #9 Cornell is the same as Providence’s, but with a pair of road games at #19 Union and #49 Rensselaer.
A pair of wins would most likely keep Cornell in the #7-#10 range. A split would likely result in a modest fall to the #9-#15 range. Getting swept in a pair of games they’re supposed to win would result in a fall for the Big Red, likely to anywhere in the #13-#19 range.
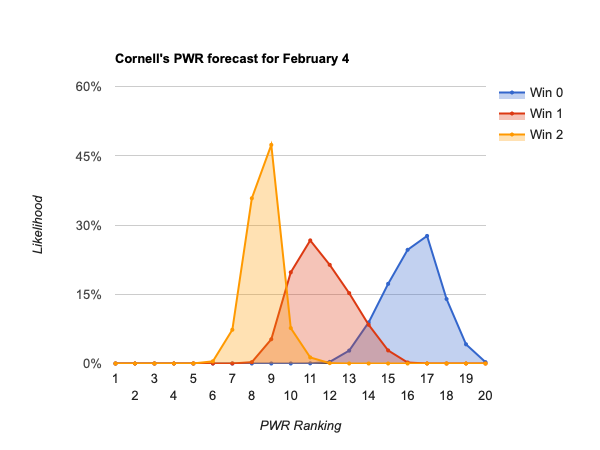
Using the PWR Calculator, you can see that if no other games were played this weekend, a pair of wins would land Cornell at #8, winning either but losing the other at #11, and a pair of losses at #17. Surprisingly, there doesn’t seem to be a big difference between losing to #19 Union or #49 Rensselaer.
How it works
Each forecast is based on at least one million monte carlo simulations of the games in the described period. For each simulation, the PairWise Ranking (PWR) is calculated and the results tallied. The probabilities presented in the forecasts are the share of simulations in which a particular outcome occurred.
The outcome of each game in each simulation is determined by random draw, with the probability of victory for each team set by their relative KRACH ratings. So, if the simulation set included a contest between team A with KRACH 300 and team B with KRACH 100, team A will win the game in very close to 75% of the simulations. I don’t simulate ties or home ice advantage.
The calculator uses the same PWR formula that mimics the NCAA’s tournament selection process that is used to produce the PWR tables on this and many other sites. But, in addition to running the formula against the games that have already been played, it lets you test scenarios by seeing what the PWR would be with different results for existing games, new results for not-yet-played games, or entirely fictitious games.