Monthly Archives: February 2020


With just 3 weeks remaining in the regular season, 9 teams’ at-large tournament hopes are on the line this weekend

Two weeks ago I identified 28 teams as still in the hunt for at-large bids. Of the 26 that are still in the hunt, 9 seem to have their at-large hopes on the line this weekend. For those teams, getting swept would seemingly knock them out of contention for an at-large bid.

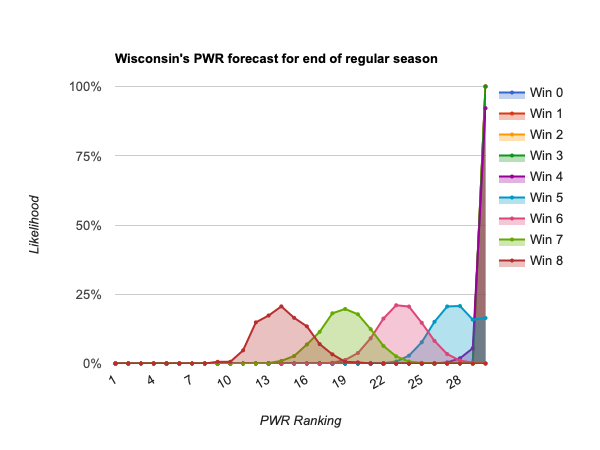
As always, you might find it helpful to follow along in the end of season PWR forecast.

Who’s in the running, no matter what happens this weekend?

As mentioned weeks ago, the top 3 are essentially (though perhaps not mathematically) locks. Those are:
#1 North Dakota
#2 Minnesota St
#3 Cornell

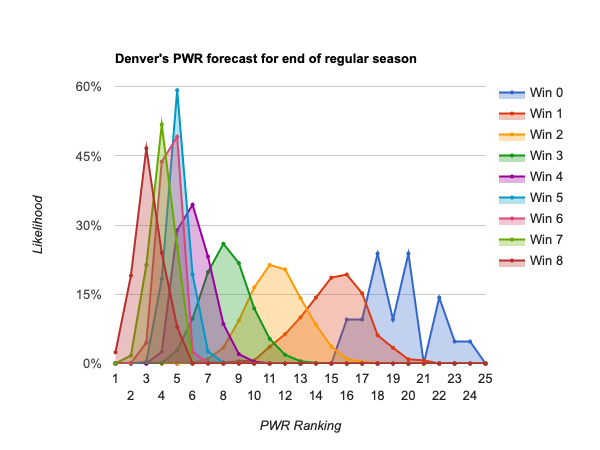
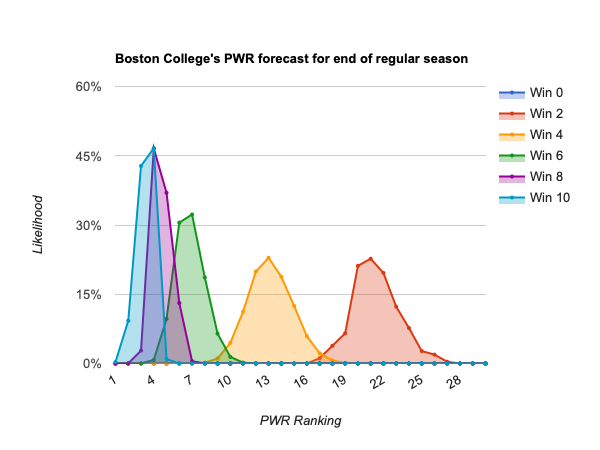
For a big range of teams, a pair of wins this weekend would make their minimum likely end-of-season finish in the #11-13 range–not quite guaranteed a bid, but very likely. Those are:
#4 Minnesota-Duluth
#5 Denver
#6 Boston College
#7 Clarkson
#8 Massachusetts
#9 Penn St
#10 Arizona St
#11 Northeastern

Then, there just a couple teams that would still control their own destiny with a pair of losses this weekend. These teams could finish the regular season as high as #11-13 despite a pair of losses this weekend if they win the remainder of their games and get a bit lucky.

#12 Bemidji St
#13 Ohio St

Then, it gets interesting. The #14-28 block contains teams that would still be alive if swept interspersed with some that would seemingly be knocked out contention for an at-large bid if swept this weekend.

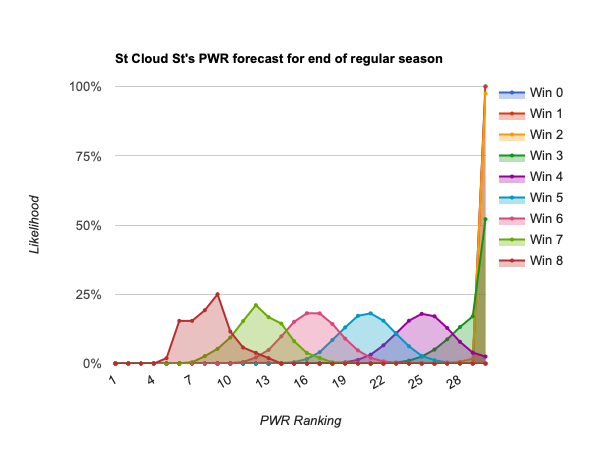
The teams that still seem to have a chance at an at-large bid, even if swept this weekend, are:
#15 Western Michigan
#16 Mass. Lowell
#17 Minnesota
#27 St Cloud St

Of those, only #15 Western Michigan could be deemed likely to have a shot at an at-large bid if they get swept this weekend but win out. The rest would be long shots after getting swept, even if they won out after that.

Who needs a win this weekend?

For most in that #14-28 range, however, getting swept this weekend would likely knock them out of contention for an at-large bid and put them in the position of needing a conference tournament win to make the NCAAs. Those teams are:

#14 Maine
#18 Quinnipiac
#19 Providence
#20 Michigan
#21 Boston University
#22 Notre Dame
#23 Michigan St
#26 Nebraska-Omaha
#28 New Hampshire

The first few of those can stay alive with a single win, while most need a pair of wins to stay in the hunt.

Whose only hope seem to be a conference tournament championship?

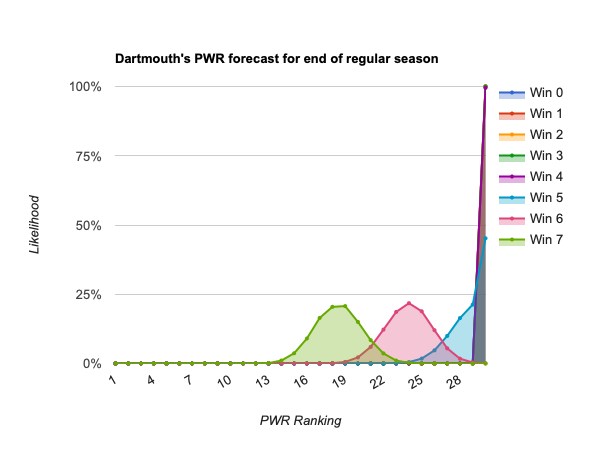
The rest of the teams don’t really stand much of a chance of an at-large bid anymore, no matter what happens. Those are:

#24 Northern Michigan
#25 Harvard
#29 American International
#30 Michigan Tech
#31 Bowling Green
#32 Sacred Heart
#33 Alaska
#34 RIT
#35 Army
#36 Wisconsin
#37 Dartmouth
#38 Yale
#39 Connecticut
#40 Rensselaer
#41 Colorado College
#42 Miami
#43 Colgate
#44 Lake Superior
#45 Holy Cross
#46 Bentley
#47 Merrimack
#48 Robert Morris
#49 Niagara
#50 Air Force
#51 Canisius
#52 Ferris St
#53 Union
#54 Brown
#55 Vermont
#56 Princeton
#57 Alaska Anchorage
#58 Alabama-Huntsville
#59 St. Lawrence
#60 Mercyhurst

Another look at which teams are likely to make the 2020 NCAA hockey tournament

Two weeks ago I wrote a First look at which teams are likely to make the 2020 NCAA hockey tournament. This article updates that with how the last two weekends’ results have changed the outlook.

Who’s a lock?

While two weeks ago there weren’t yet any mathematical guarantees, I no longer see any situation in which #1 North Dakota or #2 Minnesota State finish outside the top 10. Of course, I only search about 1,000,000 scenarios, so it might still be remotely possible (particularly if either lost out, which is so unlikely it’s still not showing up much in the scenarios).

Who’s in if they keep winning?

Two weeks ago, I identified #3 Cornell as a near lock, never dipping below #13 in the simulations. But, I did note that in the simulations Cornell never had fewer than 5 wins, so that a collapse which resulted in fewer than 5 wins in their final 12 games could push them out of contention. Cornell went 2-1-1 in the following weekends, leaving them still needing 3 more wins in their final 8 gams to be reasonably assured of being well situated going into the conference tournament.

Cornell’s situation hasn’t actually changed, Cornell is very likely to pick up the necessary wins with only two of its final eight opponents having winning records. But, as the number of games dwindles, noting how many they need to win is a bit more informative than declaring “they’re almost sure to make it”, as seemed reasonable in January.

#4 Denver is still in the position of needing to win about half of its remaining games to be sure, but will likely be in pretty good shape with just 2-3 more wins.

Who controls their own destiny?

As is to be expected this time of year, the list of teams that control their own destiny has gotten smaller. Only down through #30 St Cloud, are pretty much assured to be on the bubble if they win out.

Also, notably, #28 Michigan Tech can no longer climb onto the bubble, even if they win out.

The following teams can put themselves on the bubble if they perform well enough:
#5 Boston College
#6 Minnesota-Duluth
#7 Clarkson
#8 Massachusetts
#9 Northeastern
#10 Arizona St
#11 Ohio St
#12 Penn St
#13 Providence
#14 Quinnipiac
#15 Maine
#16 Northern Michigan
#17 Mass.-Lowell
#18 Minnesota
#19 Bemidji St
#20 Michigan St
#21 Western Michigan
#22 Notre Dame
#23 Harvard
#24 Boston University
#25 Nebraska-Omaha
#26 New Hampshire
#27 Sacred Heart
#29 Michigan
#30 St Cloud St

Of course, the teams near the top of that list require fewer wins than do teams at the bottom. Boston College will be in good shape with 5 wins, while St Cloud St really needs 8 to be sure.

Who needs help

Below that, only #31 Dartmouth and #35 Wisconsin show a significant chance of climbing onto the bubble if they win out. But they, like everyone else in this group, would likely need to win their conference tournament to prevent slipping back off the bubble with a season-ending loss.

The following teams should plan to win their conference tournaments if they want to make the NCAAs:
#28 Michigan Teach
#31 Dartmouth
#32 Alaska
#33 Army
#34 American International
#35 Wisconsin
#36 Bowling Gren
#37 RIT
#38 Connecticut
#39 Rensselaer
#40 Colgate
#41 Yale
#42 Colorado College
#43 Miami
#44 Holy Cross
#45 Bentley
#46 Air Force
#47 Robert Morris
#48 Lake Superior
#49 Merrimack
#50 Ferris St
#51 Canisius
#52 Union
#53 Niagara
#54 Princeton
#55 Vermont
#56 Alaska Anchorage
#57 Brown
#58 Alabama-Huntsville
#59 St. Lawrence
#60 Mercyhurst

What’s next?

The forecasts are updated weekly, usually Monday or Tuesday, so you can always browse them yourself. I’ll also try to post interesting interpretations here, with increasing frequency as we near the end of the regular season. Meanwhile, you can explore more of the data yourself:

How the forecast works

The forecast page notes when the forecast was last run (assume that it includes all games that had been completed as of that time).

Each forecast is based on at least one million monte carlo simulations of the games in the described period. For each simulation, the PairWise Ranking (PWR) is calculated and the results tallied. The probabilities presented in the forecasts are the share of simulations in which a particular outcome occurred.

The outcome of each game in each simulation is determined by random draw, with the probability of victory for each team set by their relative KRACH ratings. So, if the simulation set included a contest between team A with KRACH 300 and team B with KRACH 100, team A will win the game in very close to 75% of the simulations. I don’t simulate ties or home ice advantage.