Category Archives: collegehockeyranked.com


First PWR forecast of the 2020s (and why you might care)

If you care about what teams will make the NCAA hockey tournament, keeping an eye on this site between now and the selection show in March will give you a wealth of insight on how each team’s chances play out between now and then. Unlike in most other sports, the hockey tournament selection committee uses known calculations to determine the tournament participants; so, college hockey fans have long been able to calculate with certainty who is going to be selected for the NCAA tournament once all the games have been played.

The PairWise Rankings (PWR) were developed to mimic the NCAA’s tournament selection criteria, so the final PWR ranking perfectly predicts the teams that will be selected for the NCAA tournament. Calculating the PWR rankings before all the games have been played is interesting because it can be used to help predict the final PWR. Most people start to find that calculation interesting shortly after winter break, as examined in the 2014 article, When to start looking at PWR (revisited).

Current PWR Ranking

But, the reason you care about PWR is because you’re interested in who’s going to make the NCAA tournament, and this site can give you even more insight into that. Because the PWR formula is well known, you could get the current rankings from numerous sources. But, as mentioned above, the value in today’s PWR is that it helps you guess at the final PWR. This site helps you get there by calculating how the remaining games could affect PWR and forecasting what the PWR is likely to be at the end of the regular season. The presentation of the forecasts is explained in the 2017 article, New forecast presentation—PWR by wins, and can be used to answer questions such as:

  • How many wins does my team need to make the tournament?
  • Can my team make the top 4?
  • What are some unlikely tournament seeding outcomes that could occur?

PWR forecast (What does it take for each team to finish at each PWR ranking?)

The table on the PWR by wins page shows you how many wins each team needs to likely finish the regular season at each PWR ranking.

So, for example, if #1 North Dakota wins half its remaining games (8 of 16), the Fighting Hawks are likely to finish in the #5-9 range and thus make the tournament. If UND wanted to finish in the top 4 to get a one seed, winning at least 12 games seems advisable to be most likely to go into conference tournaments in the top 4.

You can get more detail on a specific team by clicking the team name in the table to see the probability curves of how likely that team is to end the regular season with each PWR ranking with a given number of wins in its remaining scheduled games.
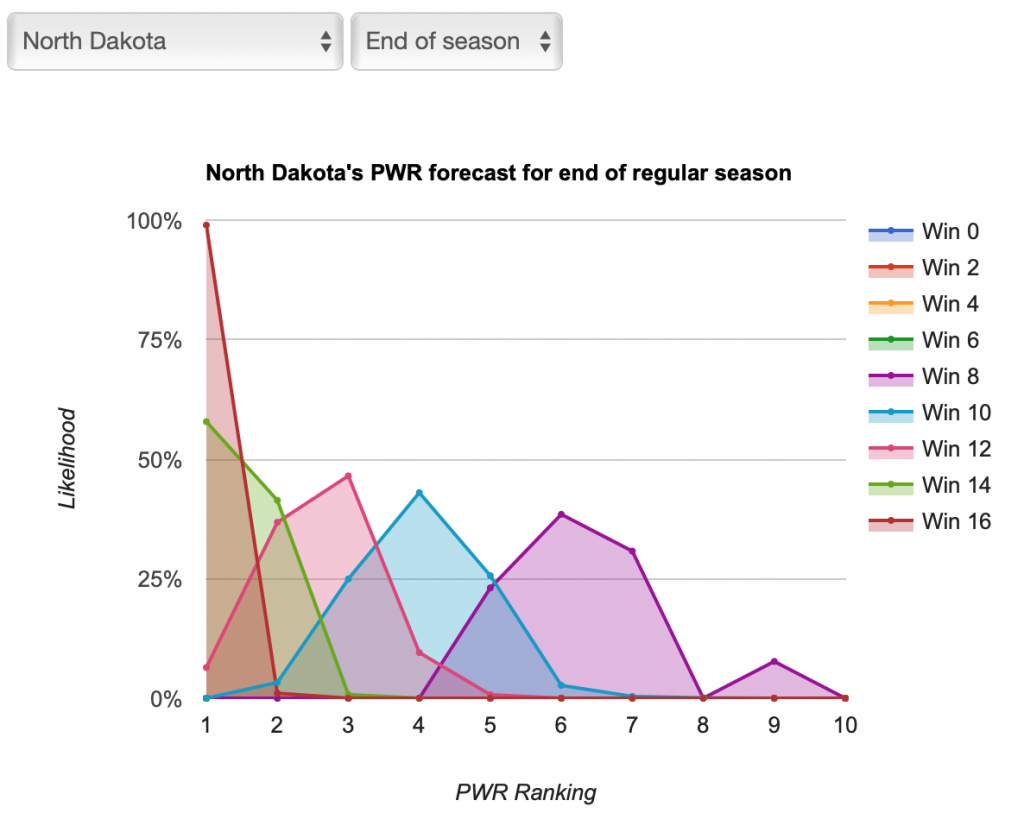
That helps you see, for example, that even though #5-9 is UND’s likely range if it wins 8 of 16, #5-7 are most likely. Similarly you can see that 12 wins would be very likely to result in a top 4 finish, while 10 wins might or might not. You can also switch from the “End of season” view to a “One week” view to see just how much the PWR is likely to change based on the outcomes of the coming weekend’s games.

The forecast data will usually be updated in the first half of the week. You can always browse all the data yourself any time, but I’ll also scour the data (including some of the background calculations that don’t yet appear on the site) and post interesting results and observations (more frequently, as the tournament approaches).

How the forecast works

The forecast page notes when the forecast was last run (assume that it includes all games that had been completed as of that time).

Each forecast is based on at least one million monte carlo simulations of the games in the described period. For each simulation, the PairWise Ranking (PWR) is calculated and the results tallied. The probabilities presented in the forecasts are the share of simulations in which a particular outcome occurred.

The outcome of each game in each simulation is determined by random draw, with the probability of victory for each team set by their relative KRACH ratings. So, if the simulation set included a contest between team A with KRACH 300 and team B with KRACH 100, team A will win the game in very close to 75% of the simulations. I don’t simulate ties or home ice advantage.

Introducing the PWR Calculator

I’m please to announce an exciting new tool, an interactive PWR calculator. The calculator lets you see how PWR would be affected if already played games had different outcomes, if future games turned out a certain way, or if unscheduled (fictional) games were played.

PWR Calculator

While changes to PWR over the years have stabilized it and removed some of its biggest quirks (the TUC cliff), it’s somewhat unavoidable in any ranking scheme that there will be outcomes that have a surprising or outsized impact. The tool makes it easy for you play “what if” and see how PWR would differ with different game outcomes.

Like everything on CollegeHockeyRanked, it was designed from the ground up to work well on your mobile device, your tablet, or a computer. It’s also exceptionally straightforward and easy to use—providing a point and click interface to try different results, filters to help you focus only on the games and rankings you care about, and instantaneous feedback on your scenarios with no recalculate button or form submissions.

Here are a few interesting things to look for in the calculator right now:

  • If #27 Harvard had beat #11 Minnesota in either game of its November 17-18 series (lost 2-4 and 1-2 in OT, respectively), Harvard’s PWR would currently be 19 instead of 27, an 8 rank jump! Winning both would have further catapulted the Crimson to 13.
  • #8 Nebraska-Omaha is happy to have split with #1 Notre Dame in the October 26-27 series. Had the Mavericks lost instead of a 6-4 win on October 26, they would now be #16 instead of #8.
  • Because a team’s PWR ranking is relative to other teams (it’s a comparison of each team to all other teams), results that don’t even involve a team can affect its fortunes. #11 Minnesota would instead be #8 right not if #16 Michigan had defeated #4 Clarkson.

Any questions? Did you find anything interesting yourself in the calculator?

New forecast presentation – PWR by wins

I’m pleased to announce an improvement to the way I present PWR forecasts this year. There were two guiding principles to the design of the new presentation:

  • The question people are really asking until conference tournaments begin is, “what will it take for my team to make the playoffs (or finish top 4)?”
  • Everyone is interested in something a little different—some are fans of a single team and just care about that team, some want to check up on rivals, and some want to dig through all the data to look for interesting outcomes.

My forecast posts in past years gave some insight into what it takes for a team to make the playoffs, but was limited to the teams I chose or scenarios I found interesting. To help expand that analysis to all teams, I sought a useful way to present all the data.

The table on the PWR By Wins page shows you how many wins each team needs to likely finish at each PWR ranking. If you want more detail on a specific team, you can click a team name to see the probability curves of how likely that team is to end the regular season with each PWR ranking with a given number of wins out of its remaining scheduled games.

This is the first public presentation of this, so I’m sure there will be some tweaks and improvements in coming weeks. Check it out, and let me know if there’s anything I can do to make this data more useful to you.

What does it take for each team to finish at each PWR rankings: PWR By Wins

Methodology

The page notes when the forecast was last run (assume that it includes all games that had been completed as of that time).

Each forecast is based on at least one million monte carlo simulations of the games in the described period. For each simulation, the PairWise Ranking (PWR) is calculated and the results tallied. The probabilities presented in the forecasts are the share of simulations in which a particular outcome occurred.

The outcome of each game in each simulation is determined by random draw, with the probability of victory for each team set by their relative KRACH ratings. So, if the simulation set included a contest between team A with KRACH 300 and team B with KRACH 100, team A will win the game in very close to 75% of the simulations. I don’t simulate ties or home ice advantage.

New ranking tables and tools

I’m pleased to announce CollegeHockeyRanked’s new ratings tables and tools. Though everything covered by this announcement is based on a previous product from another site of mine, SiouxSports.com, each has been redesigned from the ground up. The rankings include tables for RPI, PWR, and KRACH plus a comparison table of teams’ ranks across multiple ranking schemes. The historical charts page lets you view the history of KRACH, RPI and/or PWR over the course of the season in a graphical format (with coverage of over 10 seasons). Finally, the conference standings “what if” calculator lets you see what effect predicted game outcomes will have on the conference standings.

Two major design principles make these tables and tools different from previous versions on SiouxSports.com and other sites:

  • Phone, tablet, and computer support – Each was designed to be responsive to screen size to have full functionality on any size screen, but still take advantage of the extra real estate available if viewed on a large screen.
  • Supporting details – The RPI and PWR ranking tables provide a wealth of background information as to how the rankings were calculated, including information that could help you think about how future games are likely to affect those rankings. The RPI Details page (see Minnesota Duluth example) in particular was designed from the ground up to give better insight into the impact of individual game outcomes on RPI under the new RPI formula that has been in use the last couple seasons.

Getting these basic tables and tools designed for the modern web, a variety of devices, and the new RPI formula is the foundation on which I hope to build some exciting new tools and analysis in coming months and years. Stay tuned!

Welcome to Jim Dahl’s College Hockey Ranked

This site will be the home of my future musings and analysis on college hockey rankings, particularly the RPI and pairwise (PWR) rankings that mimic the NCAA’s D-I men’s hockey tournament selection process.

This isn’t a new endeavor for me, just a new home. I’ve long been interested in the rankings, and over the years have participated in a lot of message board analysis and prognostication. The types of questions I like to think about are:

  • What would happen to its PWR if Boston College swept this weekend?
  • Is Minnesota a lock for the tournament?
  • What does Quinnipiac need to do for the rest of the season to make the tournament?
  • Which of Miami’s comparisons are most likely to flip?

Over the years, I’ve built a set of calculators and tools to help myself and others answer questions like the above. Many of those tools were posted at SiouxSports.com (another site of mine). They include the following:

For the past seven seasons I’ve also been running simulations of the remaining college hockey season to forecast what could happen to PWR in coming games.

My goal with this site is to try to bring together all of that ranking news and analysis (and perhaps some exciting new stuff) into one place so it’s easier for people to find and use. I hope that separating it from the North Dakota-specific content of SiouxSports.com will make it more accessible to the broader college hockey community.

The first step is this blog, so watch for some new analysis soon!