So long, and thanks for all the fish!

I’m taking a break (indefinite?) from updating this site. There are a number of reasons now is the right time, but first a look back!

It’s been about 20 years that I’ve been independently calculating PWR, first at SiouxSports.com, then 8 years ago, launching this site. I did it because while there were a few other sources for the PWR table itself, I noticed that when my friends and I were discussing PWR, we were doing a lot of repetitive work that a computer could be doing. I felt that by making that information more accessible, I could add a lot to fans’ understanding of PWR.

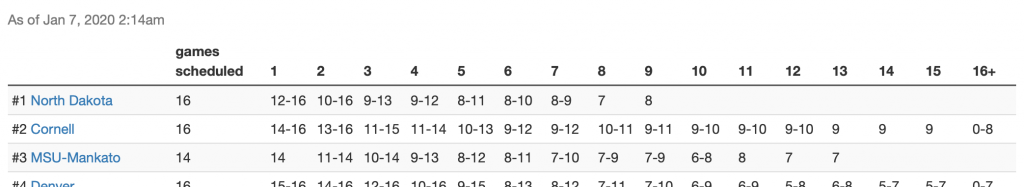
What we were all always interested in about PWR was knowing what changes were likely, so my first innovation was the teams’ comparison details, which puts in front of the reader precisely how a teams’ PWR is calculated, making it much easier to guess at likely changes in the future.

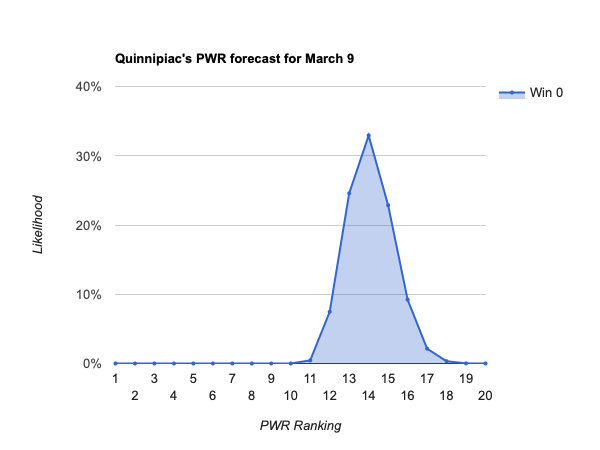
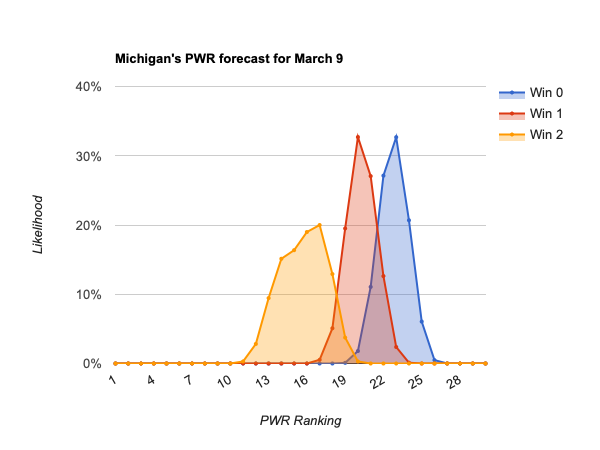
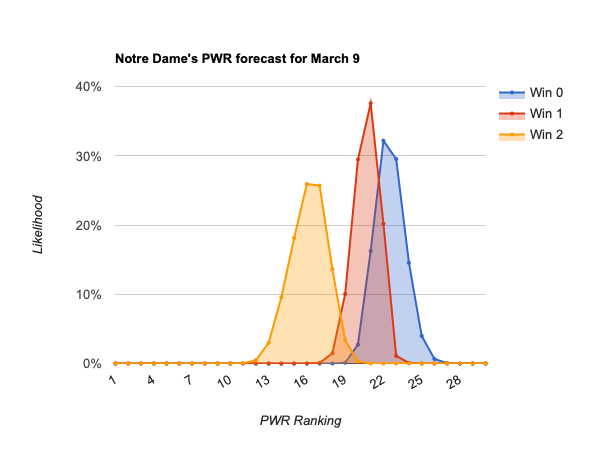
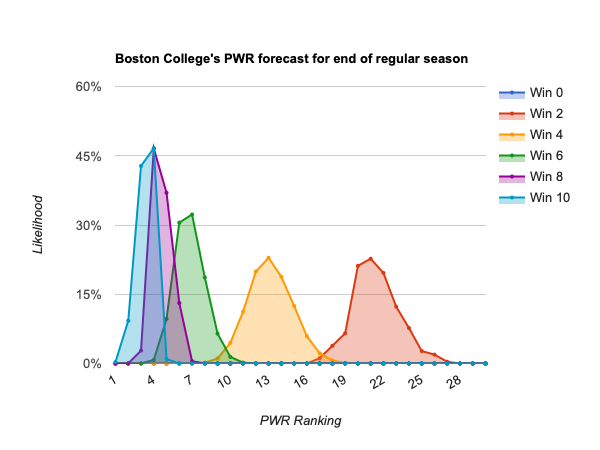
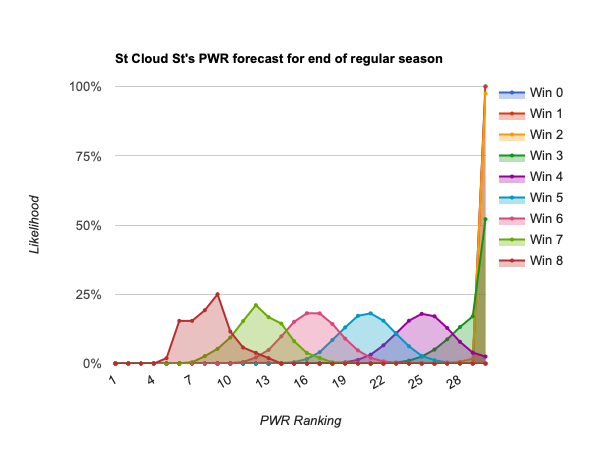
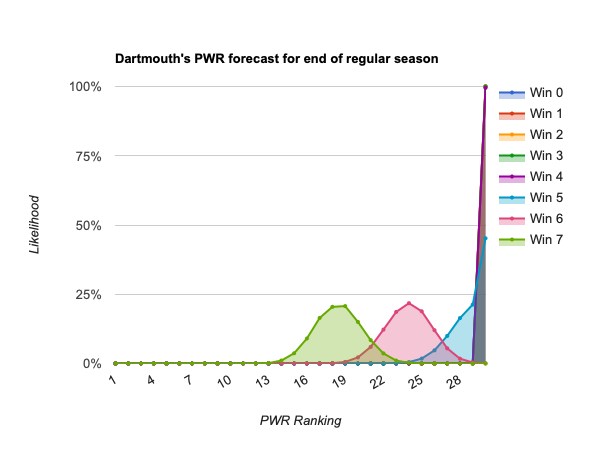
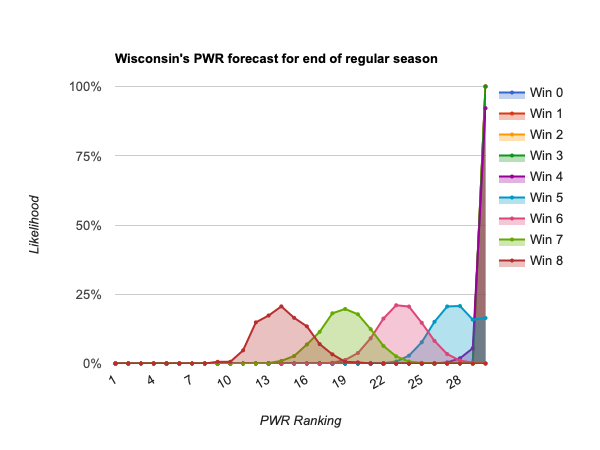
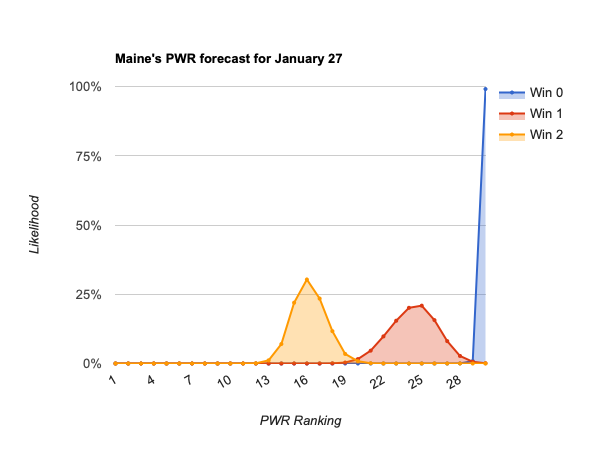
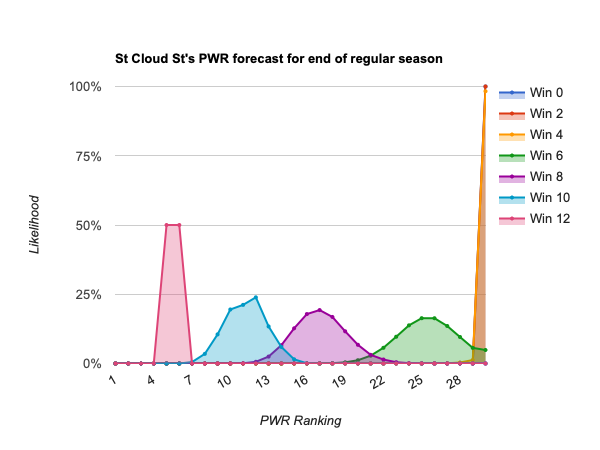
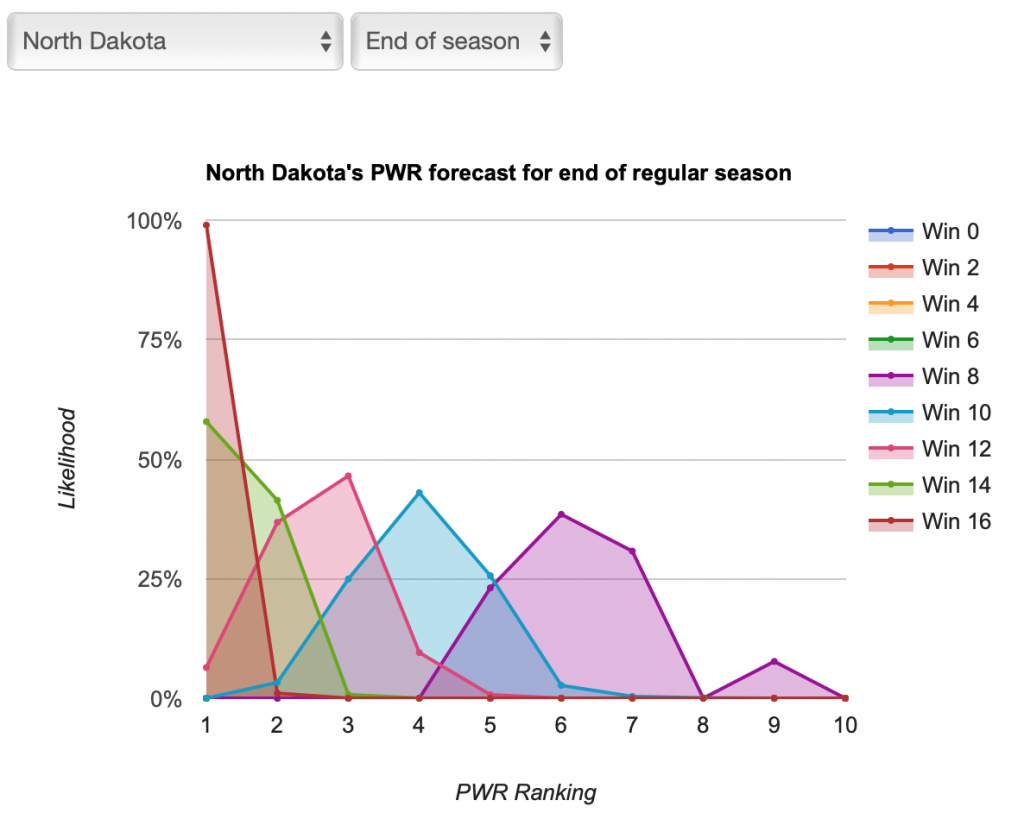
About 15 years ago, I took it a step further, realizing that by simulating a weekend’s games, I could forecast likely PWR changes, based on whether a team wins or loses. This truly automated the work we all used to do notepads and the backs of envelopes, providing (somewhat) easy to interpret probability distributions of a teams’ likely PWR based its own performance. This sort of “UND needs to win about half its remaining games to get a bid” prediction was quite revolutionary at the time.

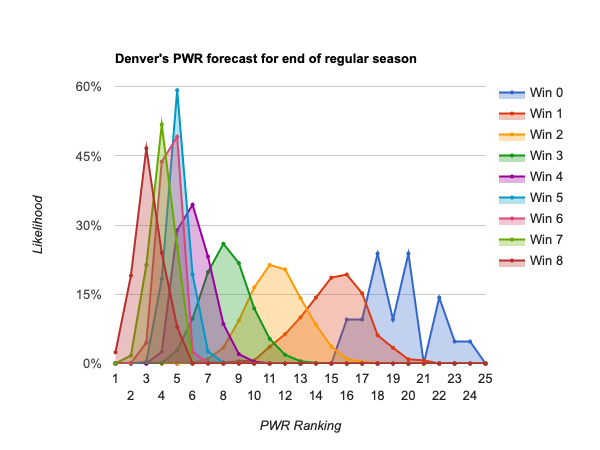
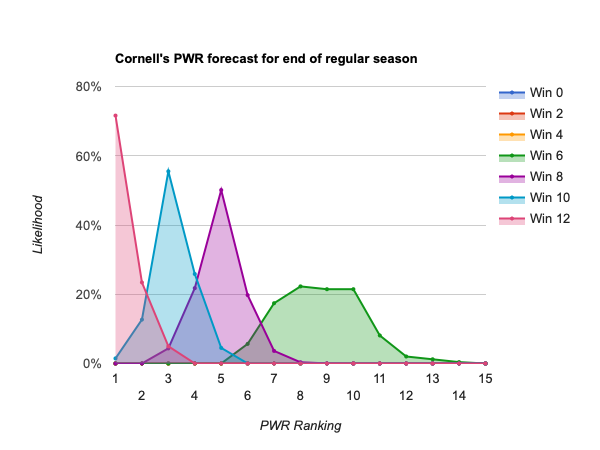
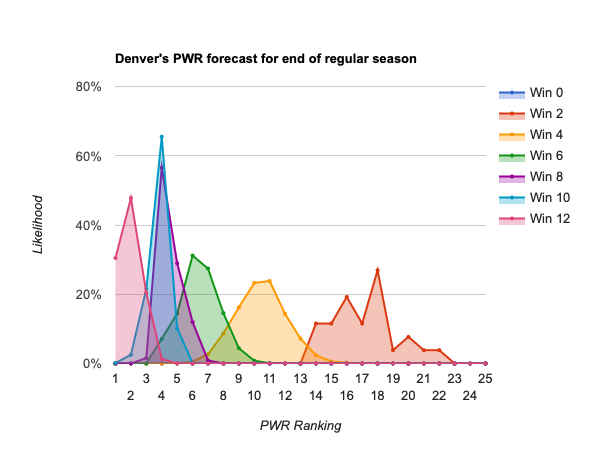
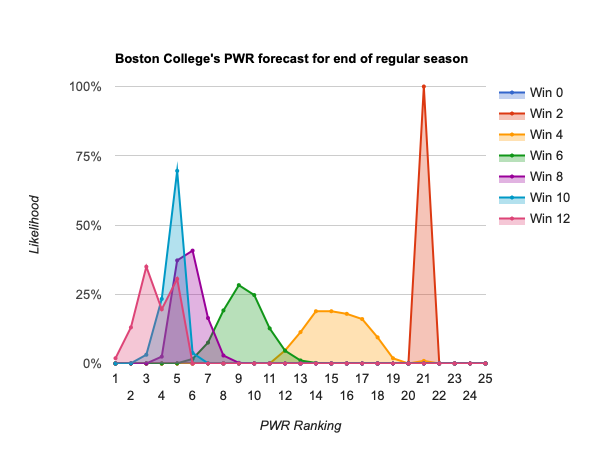
Finally, realizing that the reason we care about forecasting PWR is that we really want to know who’s going to make the tournament at the end of the season, I created the analysis of the wins needed to get a particular PWR rank table, which lets you see at a glance where every team is likely to fall based on its performance in its remaining games. I’m again proud of the simplicity of the presentation which, though it seems obvious in retrospect, was quite groundbreaking in making that sort of information accessible to everyone.

So why stop now? This year really is a perfect storm of conditions for me, as the amount of worked peaked right at a point my interest has fallen. First, because of the pandemic, I just haven’t paid attention to this site or college hockey much in the last two years. Second, over the years other have built on those innovations (imitation being the sincerest form of flattery), so me reviving this work is less necessary for the community. Third, the data source for college hockey scores that I (and the rest of the college hockey community) have been using for 20 years also shut down this year. Finally, the NCAA implemented the first major change to the PWR formula since 2013-14–crediting an OT win as only .55 of a win, thus necessitating a fair amount of work for me to get the rankings accurate again.

So, I’m going to hit the “pause” button on updating this site. Because I don’t want to post inaccurate information, I’ll take down the PWR/RPI tables, but as I mentioned above there are other great sources! I’ll leave the blog here as a historical archive for some time.

So long, and I’m sure I’ll see you around!

Just 15 teams still jockeying for at-large NCAA tournament bids as conference tournaments begin

Some conference tournaments begin this weekend, and the NCAA tournament outlook for most teams is already pretty well known. Only about 15 teams (of 60) have a fair amount of uncertainty as to whether they’ll make the NCAA tournament at-large. The top 7 teams are pretty safe bets (though not all mathematical locks), leaving at most 8 slots for the 15 in question. The other 38 teams are extremely unlikely to make the NCAAs at-large, though could steal a spot from one of the 15 by winning their conference tournament.

Remember that although 16 teams make the tournament, it’s not necessarily the top 16 in PWR who make it. For each conference autobid that comes from outside the top 16, one fewer of the top 16 will get an at-large berth. Because the Atlantic Hockey autobid is sure not to be a team that would make the NCAAs at large, there are already only 15 slots available for teams to make it on the basis of their ranking. That number could be reduced if additional conference tournaments are won by teams that would not have made the tournament at-large.

Who’s (probably) in?

  • #1 North Dakota
  • #2 Minnesota St
  • #3 Cornell
  • #4 Boston College
  • #5 Minnesota-Duluth
  • #6 Denver
  • #7 Penn St

Who’s alive no matter what happens this weekend?

  • #8 Massachusetts
  • #9 Clarkson
  • #10 Bemidji St
  • #11 Ohio St
  • #12 Arizona St
  • #13 Mass.-Lowell
  • #14 Quinnipiac
  • #15 Maine
  • #18 Northeastern
  • #19 Western Michigan
  • #21 Providence
  • #22 St Cloud St

#8 Massachusetts is nearly safe, only being able to dip as low as #11 if they have a season-ending loss on Thursday. But, their PWR could be negatively affected by the outcomes of remaining games in which they aren’t playing, and they wouldn’t quite be safe if they fell to #12-13 (those ranked teams would not get bids in the unlikely event that 4-5 conference autobids go to teams that wouldn’t otherwise make it at large).

While #9 Clarkson looks slightly safer, with minimal movement likely this weekend, they still have a best-of-3 conference tournament series remaining, which will carry the potential for downward movement.

The Hockey East and NCHC teams near the bottom of the list are alive because those conferences’ tournaments have not yet begun, so even with a winless weekend, those teams will have one more shot at raising their PWR with some wins.

Who can stay alive for an at-large bid only by winning this weekend?

  • #16 Michigan
  • #17 Minnesota
  • #20 Notre Dame

The above listed teams will be below #16 in PWR if they lose this weekend, and eliminated form their conference tournament, so with no remaining shot at an NCAA bid.

Whose only chance for an NCAA bid is winning their conference tournament?

  • #23 Michigan State
  • #24 Sacred Heart
  • #25 Bowling Green
  • #26 Northern Michigan
  • #27 American International
  • #28 Wisconsin
  • #29 Harvard
  • #30 Boston University
  • #31 New Hampshire
  • #32 Connecticut
  • #33 Alaska
  • #34 Michigan Tech
  • #35 Nebraska-Omaha
  • #36 Rensselaer
  • #37 RIT
  • #38 Army
  • #39 Dartmouth
  • #40 Yale
  • #41 Colorado College
  • #42 Miami
  • #43 Colgate
  • #44 Lake Superior
  • #45 Merrimack
  • #46 Bentley
  • #47 Niagara
  • #48 Robert Morris
  • #49 Air Force
  • #50 Canisius
  • #51 Holy Cross
  • #52 Brown
  • #53 Vermont
  • #54 Union
  • #55 Ferris St
  • #56 Alaska Anchorage
  • #57 Princeton
  • #58 Alabama-Huntsville
  • #59 St. Lawrence
  • #60 Mercyhurst

What’s next?

The forecasts are updated weekly, usually Monday or Tuesday, so you can always browse them yourself. I’ll also try to post interesting interpretations here, with increasing frequency as we near the end of the regular season. Meanwhile, you can explore more of the data yourself:

How the forecast works

The forecast page notes when the forecast was last run (assume that it includes all games that had been completed as of that time).

Each forecast is based on at least one million monte carlo simulations of the games in the described period. For each simulation, the PairWise Ranking (PWR) is calculated and the results tallied. The probabilities presented in the forecasts are the share of simulations in which a particular outcome occurred.

The outcome of each game in each simulation is determined by random draw, with the probability of victory for each team set by their relative KRACH ratings. So, if the simulation set included a contest between team A with KRACH 300 and team B with KRACH 100, team A will win the game in very close to 75% of the simulations. I don’t simulate ties or home ice advantage.

With just 3 weeks remaining in the regular season, 9 teams’ at-large tournament hopes are on the line this weekend

Two weeks ago I identified 28 teams as still in the hunt for at-large bids. Of the 26 that are still in the hunt, 9 seem to have their at-large hopes on the line this weekend. For those teams, getting swept would seemingly knock them out of contention for an at-large bid.

As always, you might find it helpful to follow along in the end of season PWR forecast.

Who’s in the running, no matter what happens this weekend?

As mentioned weeks ago, the top 3 are essentially (though perhaps not mathematically) locks. Those are:
#1 North Dakota
#2 Minnesota St
#3 Cornell

For a big range of teams, a pair of wins this weekend would make their minimum likely end-of-season finish in the #11-13 range–not quite guaranteed a bid, but very likely. Those are:
#4 Minnesota-Duluth
#5 Denver
#6 Boston College
#7 Clarkson
#8 Massachusetts
#9 Penn St
#10 Arizona St
#11 Northeastern

Then, there just a couple teams that would still control their own destiny with a pair of losses this weekend. These teams could finish the regular season as high as #11-13 despite a pair of losses this weekend if they win the remainder of their games and get a bit lucky.

#12 Bemidji St
#13 Ohio St

Then, it gets interesting. The #14-28 block contains teams that would still be alive if swept interspersed with some that would seemingly be knocked out contention for an at-large bid if swept this weekend.

The teams that still seem to have a chance at an at-large bid, even if swept this weekend, are:
#15 Western Michigan
#16 Mass. Lowell
#17 Minnesota
#27 St Cloud St

Of those, only #15 Western Michigan could be deemed likely to have a shot at an at-large bid if they get swept this weekend but win out. The rest would be long shots after getting swept, even if they won out after that.

Who needs a win this weekend?

For most in that #14-28 range, however, getting swept this weekend would likely knock them out of contention for an at-large bid and put them in the position of needing a conference tournament win to make the NCAAs. Those teams are:

#14 Maine
#18 Quinnipiac
#19 Providence
#20 Michigan
#21 Boston University
#22 Notre Dame
#23 Michigan St
#26 Nebraska-Omaha
#28 New Hampshire

The first few of those can stay alive with a single win, while most need a pair of wins to stay in the hunt.

Whose only hope seem to be a conference tournament championship?

The rest of the teams don’t really stand much of a chance of an at-large bid anymore, no matter what happens. Those are:

#24 Northern Michigan
#25 Harvard
#29 American International
#30 Michigan Tech
#31 Bowling Green
#32 Sacred Heart
#33 Alaska
#34 RIT
#35 Army
#36 Wisconsin
#37 Dartmouth
#38 Yale
#39 Connecticut
#40 Rensselaer
#41 Colorado College
#42 Miami
#43 Colgate
#44 Lake Superior
#45 Holy Cross
#46 Bentley
#47 Merrimack
#48 Robert Morris
#49 Niagara
#50 Air Force
#51 Canisius
#52 Ferris St
#53 Union
#54 Brown
#55 Vermont
#56 Princeton
#57 Alaska Anchorage
#58 Alabama-Huntsville
#59 St. Lawrence
#60 Mercyhurst

Another look at which teams are likely to make the 2020 NCAA hockey tournament

Two weeks ago I wrote a First look at which teams are likely to make the 2020 NCAA hockey tournament. This article updates that with how the last two weekends’ results have changed the outlook.

Who’s a lock?

While two weeks ago there weren’t yet any mathematical guarantees, I no longer see any situation in which #1 North Dakota or #2 Minnesota State finish outside the top 10. Of course, I only search about 1,000,000 scenarios, so it might still be remotely possible (particularly if either lost out, which is so unlikely it’s still not showing up much in the scenarios).

Who’s in if they keep winning?

Two weeks ago, I identified #3 Cornell as a near lock, never dipping below #13 in the simulations. But, I did note that in the simulations Cornell never had fewer than 5 wins, so that a collapse which resulted in fewer than 5 wins in their final 12 games could push them out of contention. Cornell went 2-1-1 in the following weekends, leaving them still needing 3 more wins in their final 8 gams to be reasonably assured of being well situated going into the conference tournament.

Cornell’s situation hasn’t actually changed, Cornell is very likely to pick up the necessary wins with only two of its final eight opponents having winning records. But, as the number of games dwindles, noting how many they need to win is a bit more informative than declaring “they’re almost sure to make it”, as seemed reasonable in January.

#4 Denver is still in the position of needing to win about half of its remaining games to be sure, but will likely be in pretty good shape with just 2-3 more wins.

Who controls their own destiny?

As is to be expected this time of year, the list of teams that control their own destiny has gotten smaller. Only down through #30 St Cloud, are pretty much assured to be on the bubble if they win out.

Also, notably, #28 Michigan Tech can no longer climb onto the bubble, even if they win out.

The following teams can put themselves on the bubble if they perform well enough:
#5 Boston College
#6 Minnesota-Duluth
#7 Clarkson
#8 Massachusetts
#9 Northeastern
#10 Arizona St
#11 Ohio St
#12 Penn St
#13 Providence
#14 Quinnipiac
#15 Maine
#16 Northern Michigan
#17 Mass.-Lowell
#18 Minnesota
#19 Bemidji St
#20 Michigan St
#21 Western Michigan
#22 Notre Dame
#23 Harvard
#24 Boston University
#25 Nebraska-Omaha
#26 New Hampshire
#27 Sacred Heart
#29 Michigan
#30 St Cloud St

Of course, the teams near the top of that list require fewer wins than do teams at the bottom. Boston College will be in good shape with 5 wins, while St Cloud St really needs 8 to be sure.

Who needs help

Below that, only #31 Dartmouth and #35 Wisconsin show a significant chance of climbing onto the bubble if they win out. But they, like everyone else in this group, would likely need to win their conference tournament to prevent slipping back off the bubble with a season-ending loss.

The following teams should plan to win their conference tournaments if they want to make the NCAAs:
#28 Michigan Teach
#31 Dartmouth
#32 Alaska
#33 Army
#34 American International
#35 Wisconsin
#36 Bowling Gren
#37 RIT
#38 Connecticut
#39 Rensselaer
#40 Colgate
#41 Yale
#42 Colorado College
#43 Miami
#44 Holy Cross
#45 Bentley
#46 Air Force
#47 Robert Morris
#48 Lake Superior
#49 Merrimack
#50 Ferris St
#51 Canisius
#52 Union
#53 Niagara
#54 Princeton
#55 Vermont
#56 Alaska Anchorage
#57 Brown
#58 Alabama-Huntsville
#59 St. Lawrence
#60 Mercyhurst

What’s next?

The forecasts are updated weekly, usually Monday or Tuesday, so you can always browse them yourself. I’ll also try to post interesting interpretations here, with increasing frequency as we near the end of the regular season. Meanwhile, you can explore more of the data yourself:

How the forecast works

The forecast page notes when the forecast was last run (assume that it includes all games that had been completed as of that time).

Each forecast is based on at least one million monte carlo simulations of the games in the described period. For each simulation, the PairWise Ranking (PWR) is calculated and the results tallied. The probabilities presented in the forecasts are the share of simulations in which a particular outcome occurred.

The outcome of each game in each simulation is determined by random draw, with the probability of victory for each team set by their relative KRACH ratings. So, if the simulation set included a contest between team A with KRACH 300 and team B with KRACH 100, team A will win the game in very close to 75% of the simulations. I don’t simulate ties or home ice advantage.

PWR game of the week – Can #31 Maine climb into the mid-teens this weekend?

Long time followers of PWR know that despite seeming pretty stable overall, individual teams’ PWR rankings can move substantially under the right conditions. An 8-10 position swing in a single weekend’s pair of games is a relatively common possibility, though it often takes both an unusual outcome for the team and a lot of other things going just right around the league.

This week, however, the #31 Maine Black Bears face a stunning 18 position upside potential in their series against #5 Boston College. While the full 18 position climb is exceedingly unlikely, occurring in only 1.1% of scenarios in which Maine sweeps BC, Maine’s likely PWR ranking if they sweep are centered around #16, a 15 spot climb!

Digging into why such a big move is possible for Maine, there’s nothing unique about their situation, there are just lots of known little things about PWR and RPI adding up just right for the Black Bears facing a series they’re supposed to lose.

Warning, thar be math below!

At 10-9-4, Maine has a win percentage of .5217, and winning two more would move that to 12-9-4 and .5600. But, because of RPI game weightings (in which road wins and home losses count more than road losses and home wins), Maine’s current weighted percentage is actually .5490 and would rise to .5965 with a pair of road wins this weekend. Maine is undefeated at home, but home wins only count as 4/5 of a game, as do road losses. But, road wins would count as 6/5 of a game, giving them 50% more impact on Maine’s ratings, giving these games (if wins) outsized influence on Maine’s ratings. The other components of Maine’s RPI would also rise a bit because of BC’s strong schedule, though much more modestly (oppponents’ win% from .4927 to .5197, and opponents’ opponents’ win% from .4958 to .5012). Finally, Maine’s quality win bonus would climb from .0019 to .0057 with a pair of road wins against Boston College.

Adding all of that up, Maine’s RPI would climb from .5103 to about .5346 with a pair of road wins this weekend.

Maine’s position near the bottom of a dense cluster of RPI rankings would result in an RPI climb of .0243 leading to a substantial climb in PWR ranking. Looking at the current RPI rankings, an RPI of .5346 would be good for #16 today, 15 spots higher than Maine’s current ranking. For comparison, if Maine were .0243 lower, at .4860 RPI, they would still be #40, only 9 positions lower.

Is this really going to happen?

Of course, a road sweep against #5 Boston College (15-5-0) is a tall order. Assuming no home ice advantage, KRACH predicts Maine as only having a 19% chance of winning each game, or a 3.7% chance of the sweep (if the games were independent). But, if Maine pulled off this signature sweep, RPI and PWR would statistically reward the Black Bears for being a different team than their results to date would predict.

First look at which teams are likely to make the 2020 NCAA hockey tournament

With 10-12 regular season games remaining for most teams, we can start to get some picture of what teams need to do to end the regular season in position for an NCAA tournament bid (we generally think of ending the regular season in the top 10 as likely being in the tournament, anywhere from 10-15 as on the bubble, and 16 or below as unlikely to make it at-large).

If you’re new to this site or missed last week’s article, First PWR Forecast of 2020 (and why you might care), read that first for some background.

You can always browse the weekly forecast yourself, and might find it useful to follow along with this article, at PWR by wins forecast.

Who’s a lock?

This far out, there are no mathematical locks. Even #1 North Dakota could miss if the Hawks improbably strung together 12 losses to end their regular season. But, in 1,000,000 simulations, none of #1 North Dakota, #2 Minnesota State, or #3 Cornell dipped below #13 (with 2, 4, and 5 being the minimum number of wins simulated for each, respectively). It would take an unprecedented collapse for any of the three to miss.

Unless something fundamentally changes that makes their success to date not predictive of future results, it would take a 1 in a 1,000,000 collapse for any of the following teams to miss the NCAA tournament:
#1 North Dakota
#2 Minnesota State
#3 Cornell

Who’s in if they keep performing as they have to date?

Surprisingly, in addition to the above, only #4 Denver seems almost assured an at-large berth if they win half their remaining games.

The lone team likely to be assured a berth if they keep winning is:
#4 Denver

Who controls their own destiny?

From #5 Boston College down to about #34 St Cloud State can put themselves in bubble position or better with sufficiently good performance over the remainder of the regular season.

Those teams include:
#5 Boston College
#6 Massachusetts
#7 Ohio State
#8 Clarkson
#9 Penn State
#10 Providence
#11 Arizona State
#12 Minnesota-Duluth
#13 Mass.-Lowell
#14 Northeastern
#15 Quinnipiac
#16 Michigan State
#17 Northern Michigan
#18 New Hampshire
#19 Dartmouth
#20 Harvard
#21 Notre Dame
#22 Michigan Tech
#23 Bemidji State
#24 Michigan
#25 Army
#26 Western Michigan
#27 Bowling Green
#28 Nebraska-Omaha
#29 Alaska
#30 Boston University
#31 Maine
#32 Wisconsin
#33 Minnesota
#34 St. Cloud St

Of course, teams near the top of that list have an easier path (winning about 50% of remaining games for #5 Boston College) than teams near the bottom of that list (winning about 80% of remaining games for #34 St. Cloud St).

Who needs help

From #35 down, there aren’t a lot of opportunities to climb onto the bubble. Quite a few in the #35-45 range seem to have a possibility of climbing just onto the bubble with a perfect or near perfect remainder of the regular season. But, even if that unlikely outcome were to occur, anything short of a conference tournament championship would result in a season ending loss that would likely push them back out of contention for an at-large bid. If you like super long shots, the teams with the best chance of that scenario are #35 Sacred Heart, #36 Connecticut, #37 Colorado College, #39 Colgate, and #41 Yale.

The following teams should plan to win their conference tournaments if they want to make the NCAAs:
#35 Sacred Heart
#36 Connecticut
#37 Colorado College
#38 American International
#39 Colgate
#40 RIT
#41 Yale
#42 Miami
#43 Rensselaer
#44 Air Force
#45 Robert Morris
#46 Holy Cross
#47 Lake Superior
#48 Merrimack
#49 Canisius
#50 Bentley
#51 Vermont
#52 Ferris State
#53 Princeton
#54 Union
#55 Niagara
#56 Alaska Anchorage
#57 Brown
#58 Mercyhurst
#59 St. Lawrence
#60 Alabama-Huntsville

What next?

The forecasts are updated weekly, usually Monday or Tuesday, so you can always browse them yourself. I’ll also try to post interesting interpretations here, with increasing frequency as we near the end of the regular season. Meanwhile, you can explore more of the data yourself:

First PWR forecast of the 2020s (and why you might care)

If you care about what teams will make the NCAA hockey tournament, keeping an eye on this site between now and the selection show in March will give you a wealth of insight on how each team’s chances play out between now and then. Unlike in most other sports, the hockey tournament selection committee uses known calculations to determine the tournament participants; so, college hockey fans have long been able to calculate with certainty who is going to be selected for the NCAA tournament once all the games have been played.

The PairWise Rankings (PWR) were developed to mimic the NCAA’s tournament selection criteria, so the final PWR ranking perfectly predicts the teams that will be selected for the NCAA tournament. Calculating the PWR rankings before all the games have been played is interesting because it can be used to help predict the final PWR. Most people start to find that calculation interesting shortly after winter break, as examined in the 2014 article, When to start looking at PWR (revisited).

Current PWR Ranking

But, the reason you care about PWR is because you’re interested in who’s going to make the NCAA tournament, and this site can give you even more insight into that. Because the PWR formula is well known, you could get the current rankings from numerous sources. But, as mentioned above, the value in today’s PWR is that it helps you guess at the final PWR. This site helps you get there by calculating how the remaining games could affect PWR and forecasting what the PWR is likely to be at the end of the regular season. The presentation of the forecasts is explained in the 2017 article, New forecast presentation—PWR by wins, and can be used to answer questions such as:

  • How many wins does my team need to make the tournament?
  • Can my team make the top 4?
  • What are some unlikely tournament seeding outcomes that could occur?

PWR forecast (What does it take for each team to finish at each PWR ranking?)

The table on the PWR by wins page shows you how many wins each team needs to likely finish the regular season at each PWR ranking.

So, for example, if #1 North Dakota wins half its remaining games (8 of 16), the Fighting Hawks are likely to finish in the #5-9 range and thus make the tournament. If UND wanted to finish in the top 4 to get a one seed, winning at least 12 games seems advisable to be most likely to go into conference tournaments in the top 4.

You can get more detail on a specific team by clicking the team name in the table to see the probability curves of how likely that team is to end the regular season with each PWR ranking with a given number of wins in its remaining scheduled games.

That helps you see, for example, that even though #5-9 is UND’s likely range if it wins 8 of 16, #5-7 are most likely. Similarly you can see that 12 wins would be very likely to result in a top 4 finish, while 10 wins might or might not. You can also switch from the “End of season” view to a “One week” view to see just how much the PWR is likely to change based on the outcomes of the coming weekend’s games.

The forecast data will usually be updated in the first half of the week. You can always browse all the data yourself any time, but I’ll also scour the data (including some of the background calculations that don’t yet appear on the site) and post interesting results and observations (more frequently, as the tournament approaches).

How the forecast works

The forecast page notes when the forecast was last run (assume that it includes all games that had been completed as of that time).

Each forecast is based on at least one million monte carlo simulations of the games in the described period. For each simulation, the PairWise Ranking (PWR) is calculated and the results tallied. The probabilities presented in the forecasts are the share of simulations in which a particular outcome occurred.

The outcome of each game in each simulation is determined by random draw, with the probability of victory for each team set by their relative KRACH ratings. So, if the simulation set included a contest between team A with KRACH 300 and team B with KRACH 100, team A will win the game in very close to 75% of the simulations. I don’t simulate ties or home ice advantage.

KRACH predicts the NCAA tournament

Everyone’s favorite college hockey ranking scheme, KRACH, has the feature that it can be used to predict the likelihood of a team winning a matchup against another team. So, it is possible to use KRACH likelihoods to determine the likelihood of each team advancing through each game of the NCAA hockey bracket.

KRACHWestGame 1Game 2
(Region
Champ)
Game 3
(Frozen
four
semifinal)
Game 4
(National
Champ)
768.0431. St Cloud St91.92%66.64%48.55%34.19%
67.5264. American Int’l8.08%1.52%0.30%0.05%
284.913. Ohio St48.92%15.36%7.70%3.65%
297.5052. Denver51.08%16.47%8.43%4.08%
Northeast
359.9521. Massachusetts63.42%36.72%14.74%7.83%
207.5864. Harvard36.58%16.18%4.62%1.84%
249.2973. Notre Dame47.69%21.90%7.05%3.11%
273.4192. Clarkson52.31%25.20%8.60%3.99%
East
392.3781. Minnesota St65.86%39.54%22.02%10.13%
203.3694. Providence34.14%14.96%5.97%1.88%
230.8413. Cornell44.51%18.94%8.12%2.77%
287.7612. Northeastern55.49%26.56%12.79%4.98%
Midwest
438.3721. Minnesota Duluth70.53%45.04%26.81%13.03%
183.1974. Bowling Green29.47%12.56%4.82%1.42%
204.1913. Arizona St41.87%15.89%6.51%2.05%
283.4632. Quinnipiac58.13%26.51%12.96%5.00%

On paper, there’s a tremendous advantage to being the #1 seed overall. Not only does St Cloud St have, by about 2-1, the highest KRACH overall; but, they’re also matched up against the lowest KRACH-rated team in the tournament, Atlantic Hockey champ American International. That gap gives the Huskies a formidable 92% chance of winning their opening game, a 67% chance of making the Frozen Four, and a 34% chance of winning the National Championship.

The remaining three regions are reasonably balanced, with each having something between a 17%-22% chance of producing the national champ.

The 1 seeds are reasonably strong, as rated by KRACH, with a 65% chance overall that one of them becomes the national champ.

The NCAA tournament field is nearly set going into the last day of conference tournaments

Though 7 conference tournament games remain, there’s not a lot of drama left around who will make the NCAA tournament.

You can always follow along on your own:
College Hockey Tournament possibilities

Who’s in?

These 12 teams are in for sure:

  • St Cloud St
  • Massachusetts
  • Minnesota St
  • Minnesota-Duluth
  • Quinnipiac
  • Denver
  • Ohio St
  • Northeastern
  • Clarkson
  • Arizona St
  • Cornell
  • Harvard

Who else can make it

Both participants in the NCHC and ECAC tournaments are already in.

The winner of the Big Ten tournament will also make it (and the loser will not):

  • Penn State or
  • Notre Dame

The winner of Atlantic Hockey will also make it (and the loser will not):

  • American International or
  • Niagara

That’s 14 teams in, and leaves 2 slots.

There are two more conference championships, Hockey East and the WCHA, whose winners can secure an invitation. These teams can lock up an invitation with a win:

  • Bowling Green
  • Boston College

But, we’re already counting their opponents, Minnesota St and Northeastern as in. So, if Minnesota State or Northeastern win, that leaves an additional slot and an opportunity for another team to make it at-large.

If BC loses, Bowling Green and Providence make it at large
If BC wins, Bowling Green makes it if they win, otherwise Providence makes it

What needs to happen for my team to make it?

Restated in terms of what they need to do to make it:

  • Penn State needs to win
  • Notre Dame needs to win
  • American International needs to win
  • Niagara needs to win
  • Boston College needs to win
  • Bowling Green needs to either win or have Northeastern defeat Boston College
  • Providence needs either Northeastern to defeat Boston College or Minnesota St defeat Bowling Green

What will be the conference representation in the NCAA tournament

The ECAC is likely to place the most teams into the NCAA tournament this year. Here’s a complete rundown of the possibilities.

 012345
Big Ten0%0%100%0%0%0%
Independent0%100%0%0%0%0%
NCHC0%0%0%75%25%0%
Atlantic Hockey0%100%0%0%0%0%
WCHA0%35%65%0%0%0%
Hockey East0%0%6%72%22%0%
ECAC0%0%0%12%80%8%

As you know from Who can make the NCAA tournament?, the winner of the Atlantic Hockey tournament is the only team from that conference that will make the NCAAs.

Similarly, the winner of the Big Ten tournament is the only team that will join Ohio State in representing the Big Ten, guaranteeing the Big Ten two representatives.

Arizona State will be the lone independent in the NCAA tournament.

The NCHC is guaranteed to get St Cloud St, Denver, and Minnesota Duluth in, and will most likely have 3 representatives. But, if (and only if) Colorado College wins the tournament, the Tigers will get an automatic bid, giving the NCHC 4 teams in the NCAAs.

The WCHA is only guaranteed one team, Minnesota State, and it is possible that the Mavericks will be the WCHA’s only representative. But, the WCHA is more likely to get 2 in by having Bowling Green join them (which could happen even if Minnesota State wins the conference tournament).

Hockey East is only guaranteed two teams, Massachusetts and Northeastern, but 3 or 4 is much more likely. Boston College or Boston University can make it by winning the conference tournament, and Providence can make it at-large.

The ECAC has the most possible different permutations of teams that could make the NCAAs, though landing 4 teams in the NCAAs is by far most likely. Quinnipiac and Clarkson are the only teams in for sure, but there is no situation in which they are the only two who make it. Brown can also make the NCAAs by winning the conference tournament. Cornell and Harvard can make it either by winning the conference tournament, or possibly by earning an at-large bid depending on other outcomes. The ECAC should see no fewer than 3 teams and no more than 5 in the NCAAs.