Some conference tournaments begin this weekend, and the NCAA tournament outlook for most teams is already pretty well known. Only about 15 teams (of 60) have a fair amount of uncertainty as to whether they’ll make the NCAA tournament at-large. The top 7 teams are pretty safe bets (though not all mathematical locks), leaving at most 8 slots for the 15 in question. The other 38 teams are extremely unlikely to make the NCAAs at-large, though could steal a spot from one of the 15 by winning their conference tournament.
Remember that although 16 teams make the tournament, it’s not necessarily the top 16 in PWR who make it. For each conference autobid that comes from outside the top 16, one fewer of the top 16 will get an at-large berth. Because the Atlantic Hockey autobid is sure not to be a team that would make the NCAAs at large, there are already only 15 slots available for teams to make it on the basis of their ranking. That number could be reduced if additional conference tournaments are won by teams that would not have made the tournament at-large.
Who’s (probably) in?
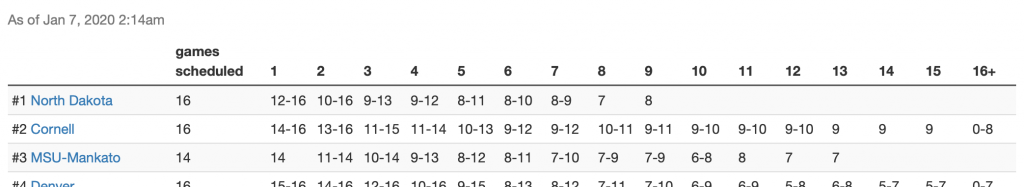
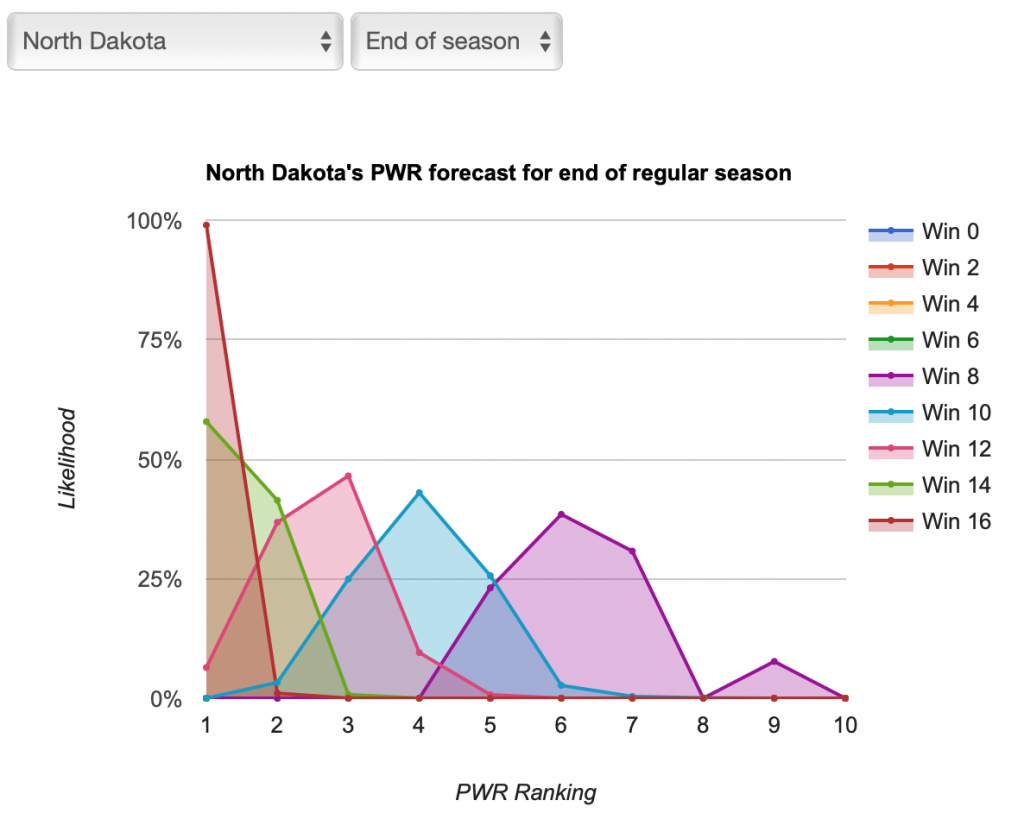
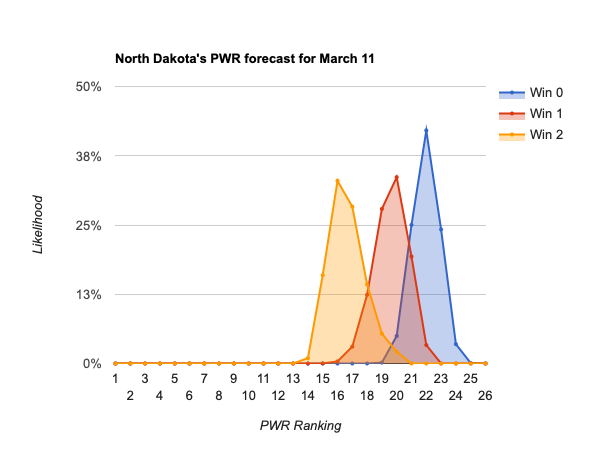
- #1 North Dakota
- #2 Minnesota St
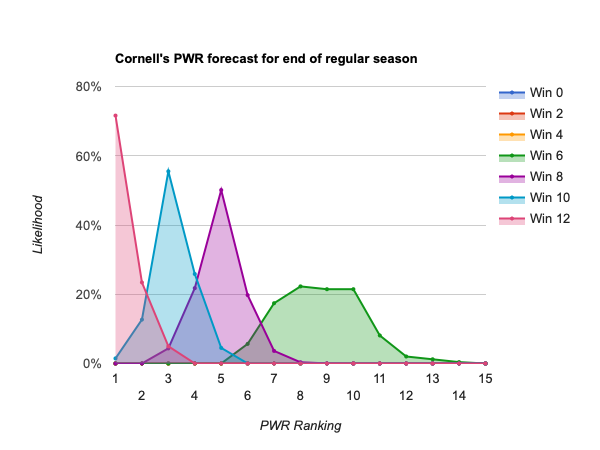
- #3 Cornell
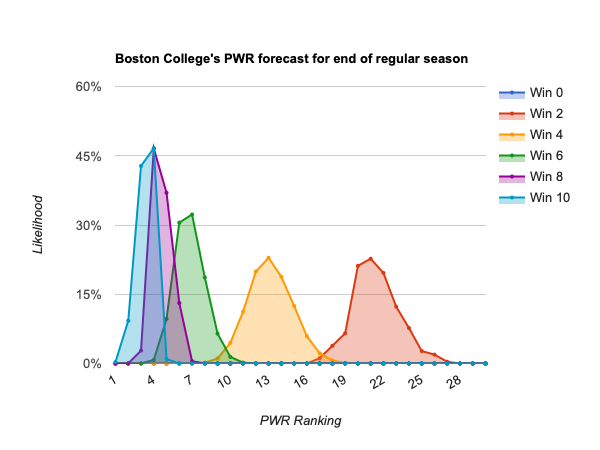
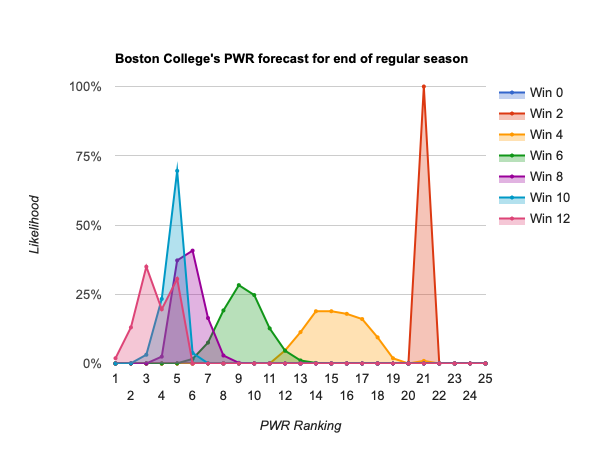
- #4 Boston College
- #5 Minnesota-Duluth
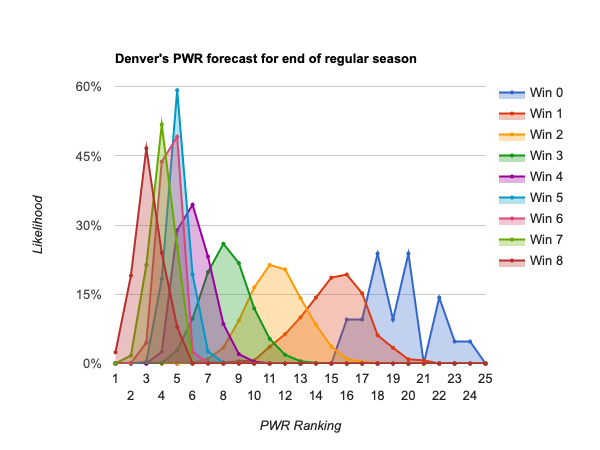
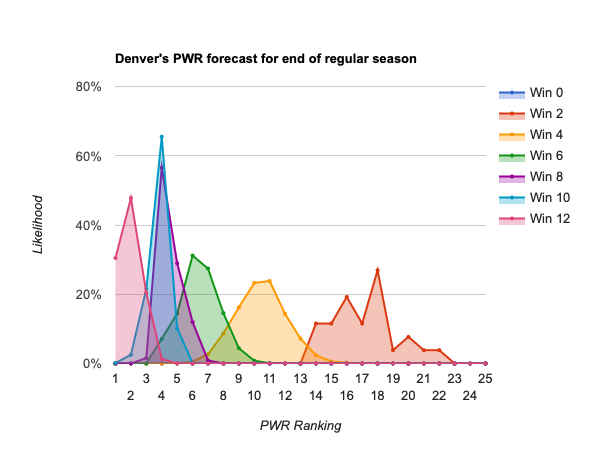
- #6 Denver
- #7 Penn St
Who’s alive no matter what happens this weekend?
- #8 Massachusetts
- #9 Clarkson
- #10 Bemidji St
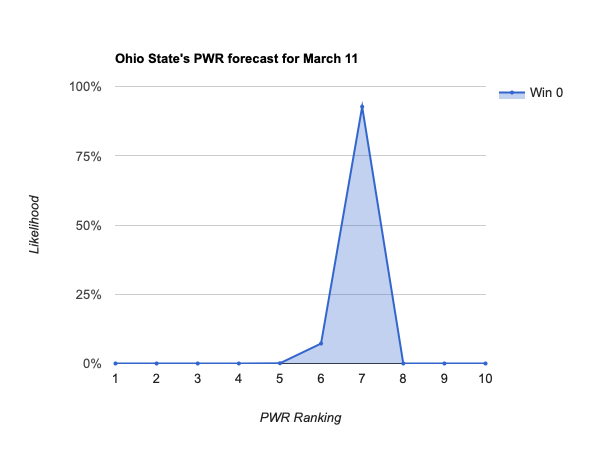
- #11 Ohio St
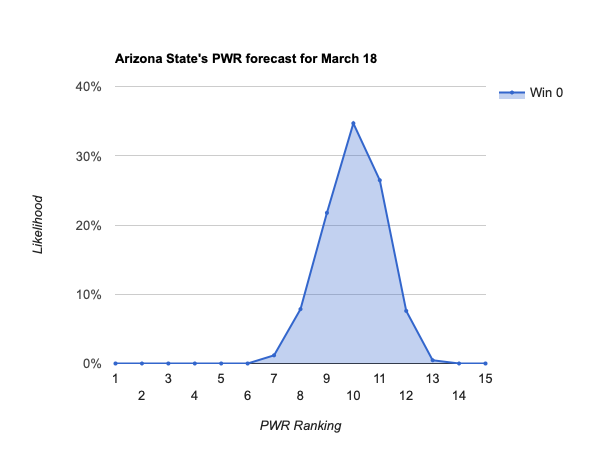
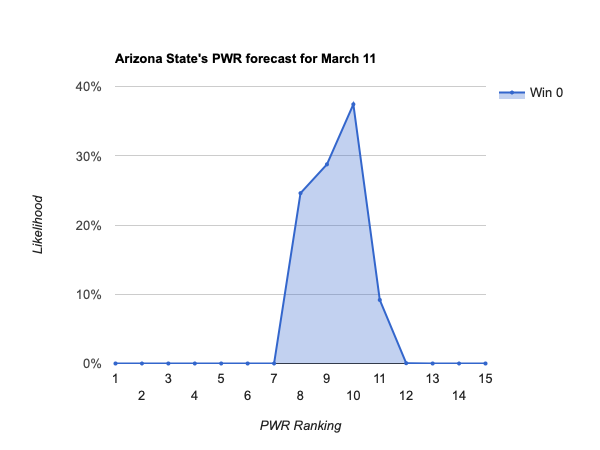
- #12 Arizona St
- #13 Mass.-Lowell
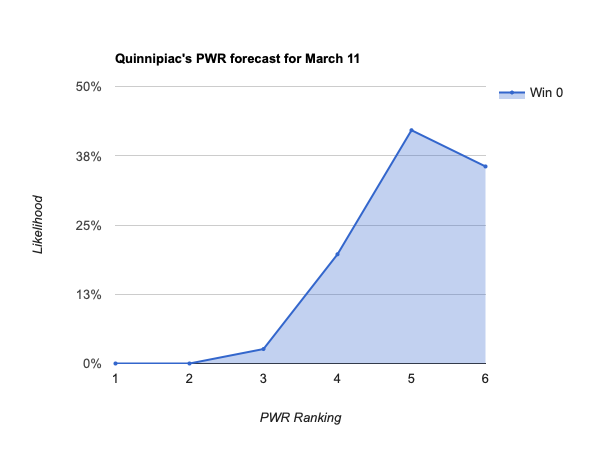
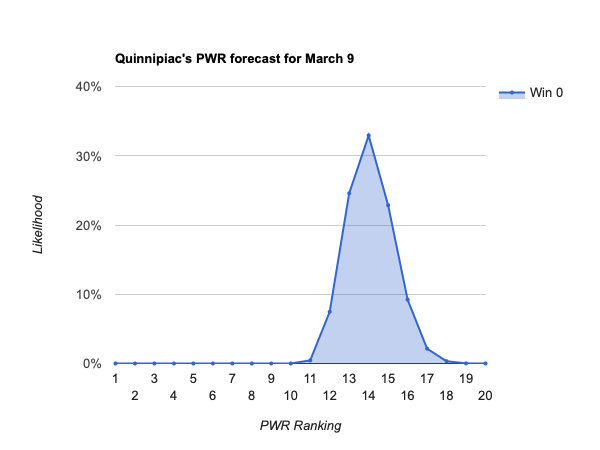
- #14 Quinnipiac
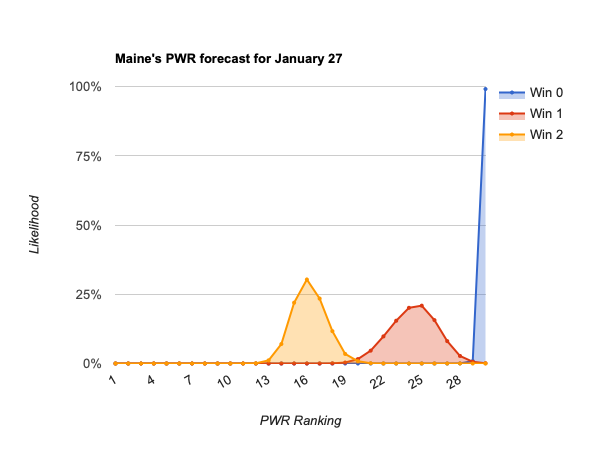
- #15 Maine
- #18 Northeastern
- #19 Western Michigan
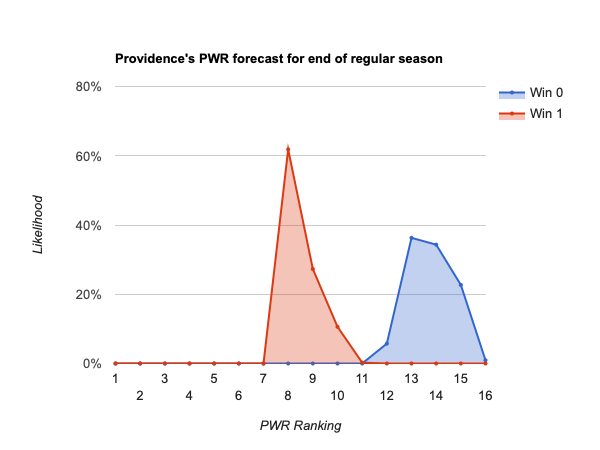
- #21 Providence
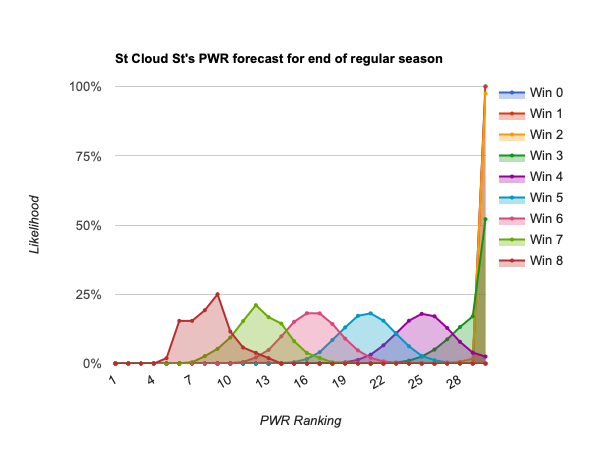
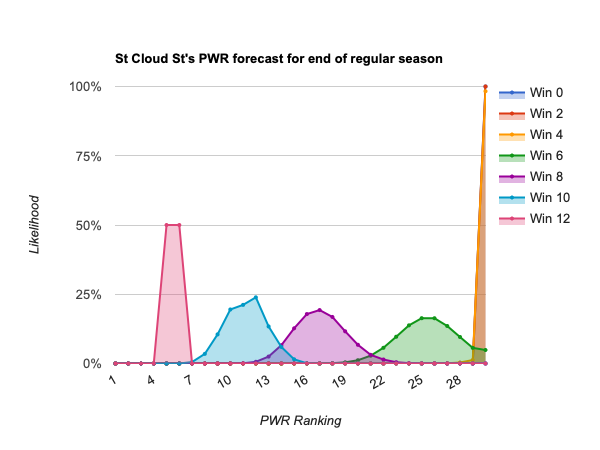
- #22 St Cloud St

#8 Massachusetts is nearly safe, only being able to dip as low as #11 if they have a season-ending loss on Thursday. But, their PWR could be negatively affected by the outcomes of remaining games in which they aren’t playing, and they wouldn’t quite be safe if they fell to #12-13 (those ranked teams would not get bids in the unlikely event that 4-5 conference autobids go to teams that wouldn’t otherwise make it at large).
While #9 Clarkson looks slightly safer, with minimal movement likely this weekend, they still have a best-of-3 conference tournament series remaining, which will carry the potential for downward movement.
The Hockey East and NCHC teams near the bottom of the list are alive because those conferences’ tournaments have not yet begun, so even with a winless weekend, those teams will have one more shot at raising their PWR with some wins.
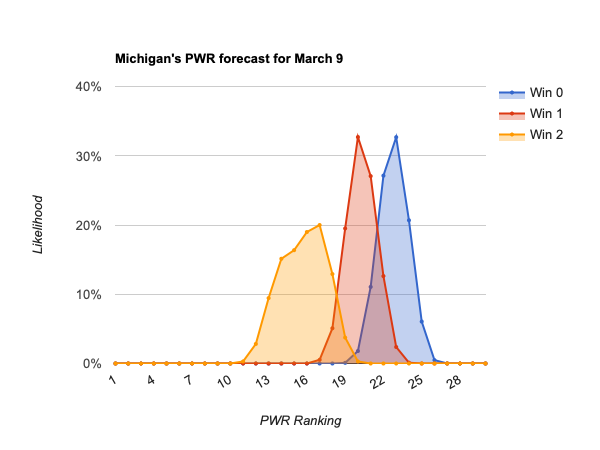
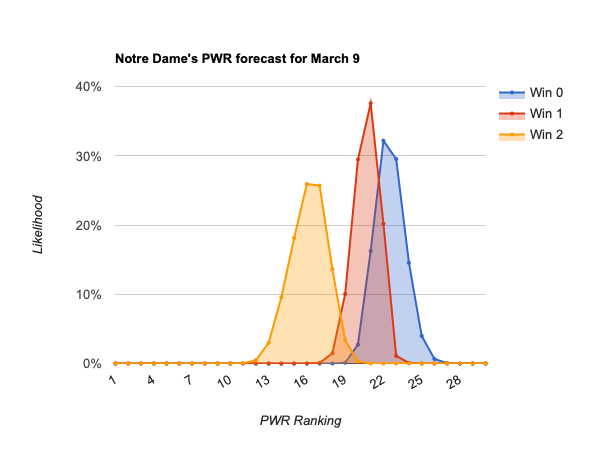
Who can stay alive for an at-large bid only by winning this weekend?
- #16 Michigan
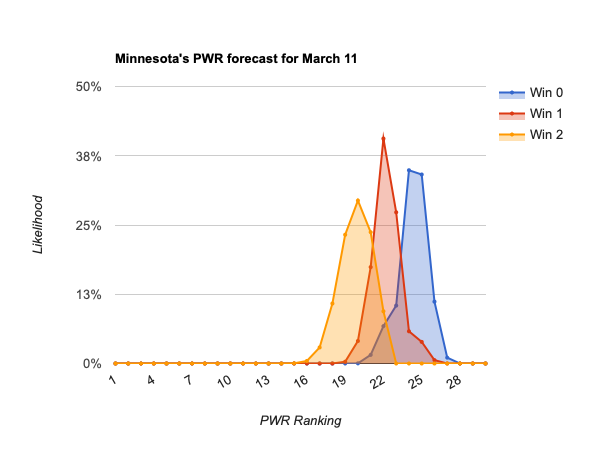
- #17 Minnesota
- #20 Notre Dame
The above listed teams will be below #16 in PWR if they lose this weekend, and eliminated form their conference tournament, so with no remaining shot at an NCAA bid.

Whose only chance for an NCAA bid is winning their conference tournament?
- #23 Michigan State
- #24 Sacred Heart
- #25 Bowling Green
- #26 Northern Michigan
- #27 American International
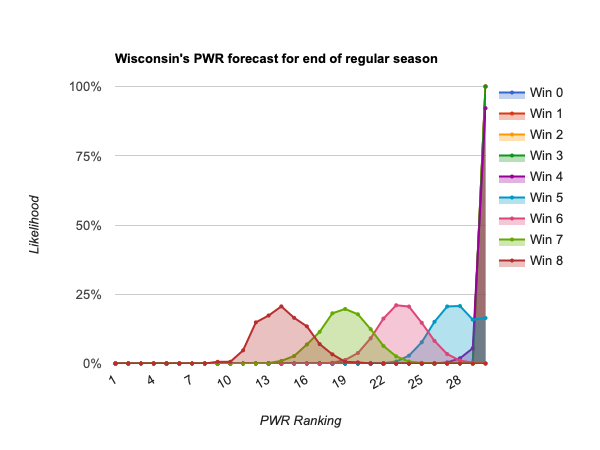
- #28 Wisconsin
- #29 Harvard
- #30 Boston University
- #31 New Hampshire
- #32 Connecticut
- #33 Alaska
- #34 Michigan Tech
- #35 Nebraska-Omaha
- #36 Rensselaer
- #37 RIT
- #38 Army
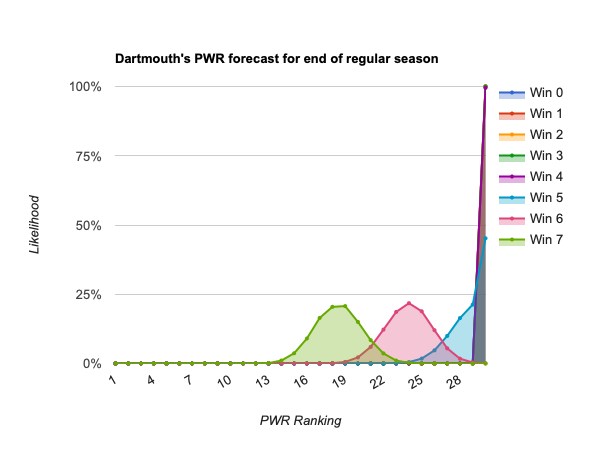
- #39 Dartmouth
- #40 Yale
- #41 Colorado College
- #42 Miami
- #43 Colgate
- #44 Lake Superior
- #45 Merrimack
- #46 Bentley
- #47 Niagara
- #48 Robert Morris
- #49 Air Force
- #50 Canisius
- #51 Holy Cross
- #52 Brown
- #53 Vermont
- #54 Union
- #55 Ferris St
- #56 Alaska Anchorage
- #57 Princeton
- #58 Alabama-Huntsville
- #59 St. Lawrence
- #60 Mercyhurst
What’s next?
The forecasts are updated weekly, usually Monday or Tuesday, so you can always browse them yourself. I’ll also try to post interesting interpretations here, with increasing frequency as we near the end of the regular season. Meanwhile, you can explore more of the data yourself:
How the forecast works
The forecast page notes when the forecast was last run (assume that it includes all games that had been completed as of that time).
Each forecast is based on at least one million monte carlo simulations of the games in the described period. For each simulation, the PairWise Ranking (PWR) is calculated and the results tallied. The probabilities presented in the forecasts are the share of simulations in which a particular outcome occurred.
The outcome of each game in each simulation is determined by random draw, with the probability of victory for each team set by their relative KRACH ratings. So, if the simulation set included a contest between team A with KRACH 300 and team B with KRACH 100, team A will win the game in very close to 75% of the simulations. I don’t simulate ties or home ice advantage.