After the holiday break is generally considered a good time to start paying attention to the PairWise Ranking (PWR). Remember that PWR is a ranking whose calculation mimics the NCAA’s tournament selection process, so the final PWR ranking perfectly predicts the teams that will be selected for the NCAA tournament. The 2014 article, When to start looking at PWR (revisited), examines how today’s PWR is reasonably predictive of the final PWR.
The reason you’re really interested in the PWR is because you want to know who is going to make the NCAA tournament. So what you really want to know is what the PWR is going to be at the end of the season. To help bridge the gap from today’s PWR to the end of season PWR, I’ve developed a forecast that shows you what the PWR is likely to be at the end of the regular season. It’s explained in the 2017 article, New forecast presentation—PWR by wins, and can be used to answer questions such as:
- How many wins does my team need to make the tournament?
- Can my team make the top 4?
- What are some unlikely tournament seeding outcomes that could occur?
PWR By Wins (What does it take for each team to finish at each PWR ranking?)
The table on the PWR By Wins page shows you how many wins each team needs to likely finish at each PWR ranking.
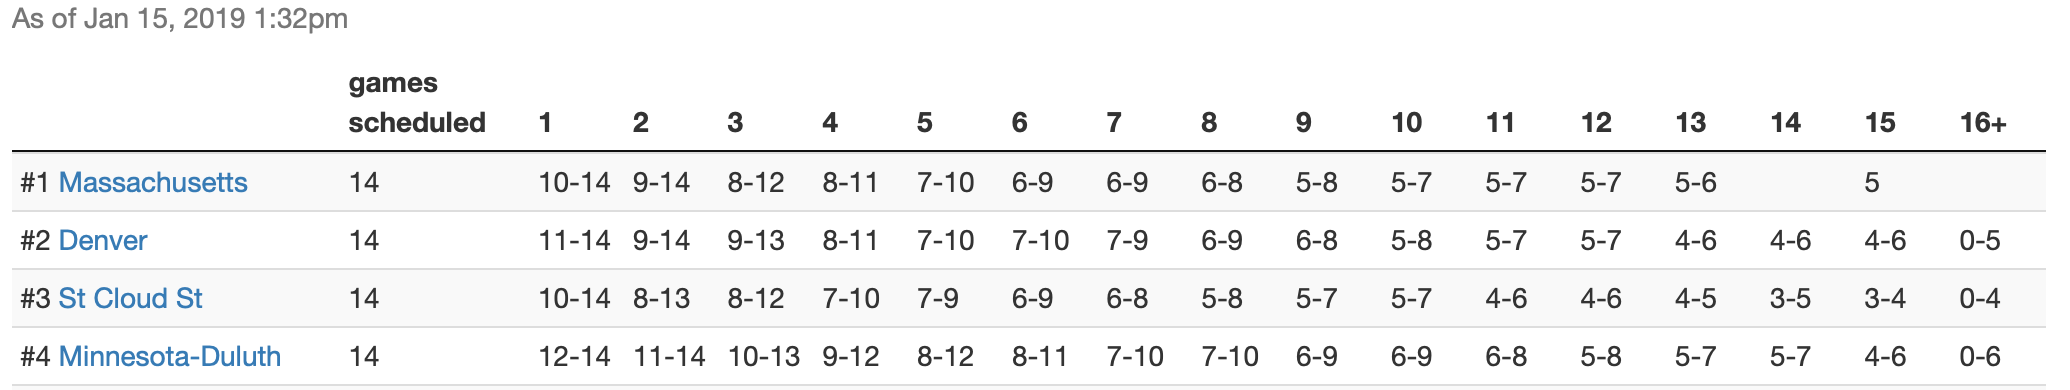
So, for example, if Mass. wins half its remaining scheduled games (7 of the 14), it will probably end the regular season in the 10-12 range, and thus likely to make the tournament.
If you want more detail on a specific team, you can click a team name to see the probability curves of how likely that team is to end the regular season with each PWR ranking with a given number of wins in its remaining scheduled games.
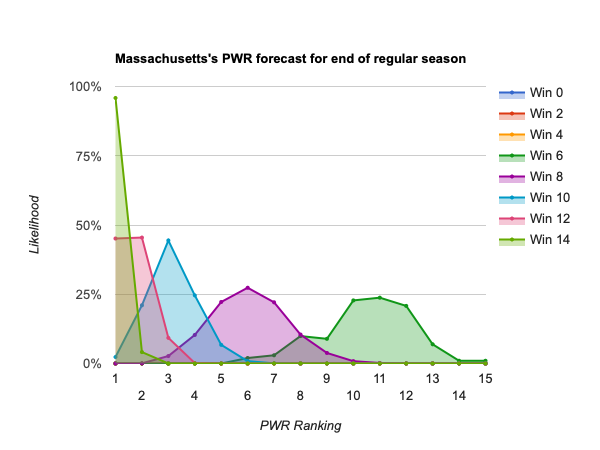
That helps you see, for example, that though Mass. has a decent change of finishing anywhere from #3 to #9 with 8 more wins, #5-#7 are much more likely.
The forecasts are usually updated in the first half of the week. You can always browse all the data any time, but I’ll also scour the data and post interesting results and observations in this space in coming weeks.
How it works
The page notes when the forecast was last run (assume that it includes all games that had been completed as of that time).
Each forecast is based on at least one million monte carlo simulations of the games in the described period. For each simulation, the PairWise Ranking (PWR) is calculated and the results tallied. The probabilities presented in the forecasts are the share of simulations in which a particular outcome occurred.
The outcome of each game in each simulation is determined by random draw, with the probability of victory for each team set by their relative KRACH ratings. So, if the simulation set included a contest between team A with KRACH 300 and team B with KRACH 100, team A will win the game in very close to 75% of the simulations. I don’t simulate ties or home ice advantage.