If you care about what teams will make the NCAA hockey tournament, keeping an eye on this site between now and the selection show in March will give you a wealth of insight on how each team’s chances play out between now and then. Unlike in most other sports, the hockey tournament selection committee uses known calculations to determine the tournament participants; so, college hockey fans have long been able to calculate with certainty who is going to be selected for the NCAA tournament once all the games have been played.
The PairWise Rankings (PWR) were developed to mimic the NCAA’s tournament selection criteria, so the final PWR ranking perfectly predicts the teams that will be selected for the NCAA tournament. Calculating the PWR rankings before all the games have been played is interesting because it can be used to help predict the final PWR. Most people start to find that calculation interesting shortly after winter break, as examined in the 2014 article, When to start looking at PWR (revisited).
But, the reason you care about PWR is because you’re interested in who’s going to make the NCAA tournament, and this site can give you even more insight into that. Because the PWR formula is well known, you could get the current rankings from numerous sources. But, as mentioned above, the value in today’s PWR is that it helps you guess at the final PWR. This site helps you get there by calculating how the remaining games could affect PWR and forecasting what the PWR is likely to be at the end of the regular season. The presentation of the forecasts is explained in the 2017 article, New forecast presentation—PWR by wins, and can be used to answer questions such as:
- How many wins does my team need to make the tournament?
- Can my team make the top 4?
- What are some unlikely tournament seeding outcomes that could occur?
PWR forecast (What does it take for each team to finish at each PWR ranking?)
The table on the PWR by wins page shows you how many wins each team needs to likely finish the regular season at each PWR ranking.
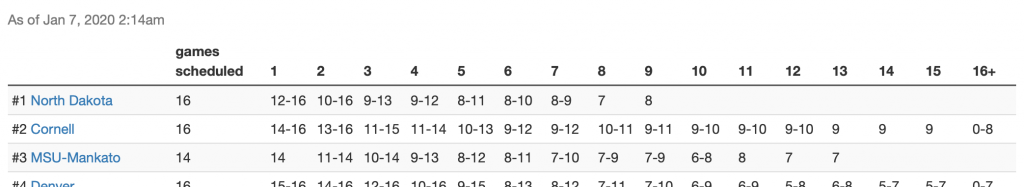
So, for example, if #1 North Dakota wins half its remaining games (8 of 16), the Fighting Hawks are likely to finish in the #5-9 range and thus make the tournament. If UND wanted to finish in the top 4 to get a one seed, winning at least 12 games seems advisable to be most likely to go into conference tournaments in the top 4.
You can get more detail on a specific team by clicking the team name in the table to see the probability curves of how likely that team is to end the regular season with each PWR ranking with a given number of wins in its remaining scheduled games.
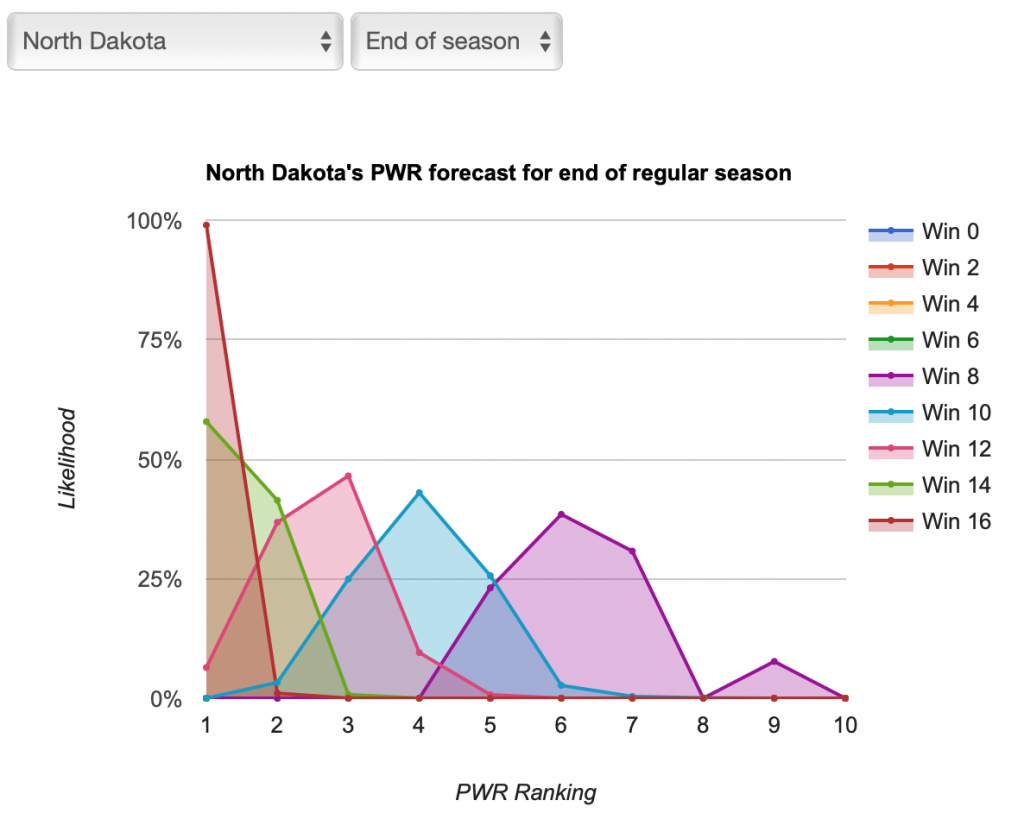
That helps you see, for example, that even though #5-9 is UND’s likely range if it wins 8 of 16, #5-7 are most likely. Similarly you can see that 12 wins would be very likely to result in a top 4 finish, while 10 wins might or might not. You can also switch from the “End of season” view to a “One week” view to see just how much the PWR is likely to change based on the outcomes of the coming weekend’s games.
The forecast data will usually be updated in the first half of the week. You can always browse all the data yourself any time, but I’ll also scour the data (including some of the background calculations that don’t yet appear on the site) and post interesting results and observations (more frequently, as the tournament approaches).
How the forecast works
The forecast page notes when the forecast was last run (assume that it includes all games that had been completed as of that time).
Each forecast is based on at least one million monte carlo simulations of the games in the described period. For each simulation, the PairWise Ranking (PWR) is calculated and the results tallied. The probabilities presented in the forecasts are the share of simulations in which a particular outcome occurred.
The outcome of each game in each simulation is determined by random draw, with the probability of victory for each team set by their relative KRACH ratings. So, if the simulation set included a contest between team A with KRACH 300 and team B with KRACH 100, team A will win the game in very close to 75% of the simulations. I don’t simulate ties or home ice advantage.
Thanks for putting this up Jim!