Tag Archives: Western Michigan


What to watch for in PWR this weekend

This article looks at the most interesting outcomes of games this weekend, with a focus on what PWR might look like next Monday. If you want a more general analysis of the remaining regular season and NCAA tournament likelihood, check out the article, NCAA tournament outlook as conferences enter final regular season weekend, and the table, Wins needed to likely end regular season at PWR rank.

Biggest upside potential

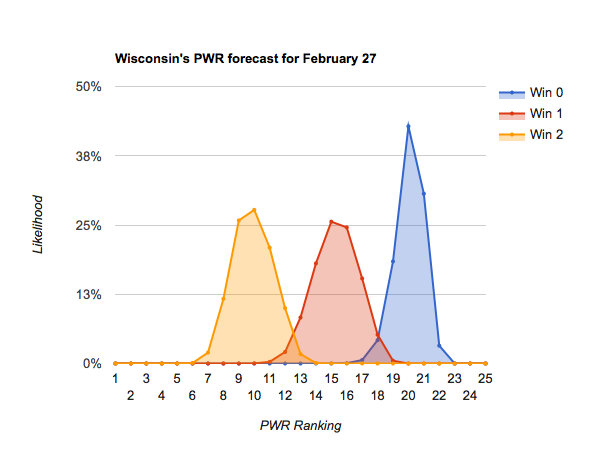
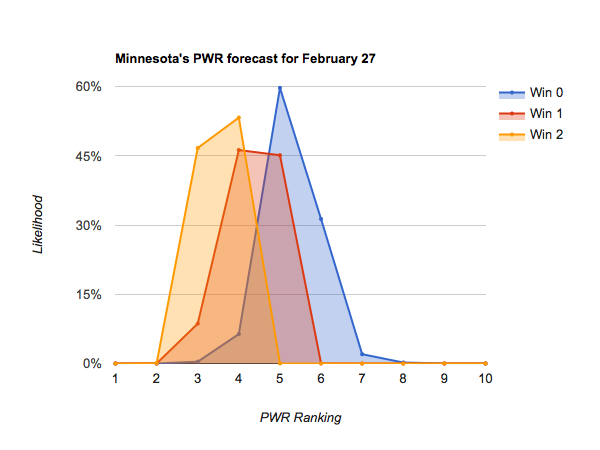
#20 Wisconsin, visiting the red hot #4 Gophers in Minneapolis, has an opportunity to surge. The Badgers could climb to the 9-11 range with a sweep (as high as 7 is realistic), but will likely just stay put if swept. Of course, in the long run staying put is not good enough for the Badgers who needs 3-4 wins in their final 6 games to climb to the bubble (see NCAA tournament outlook).

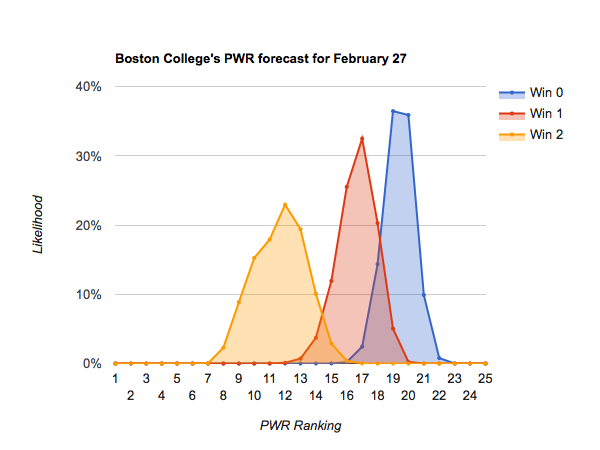
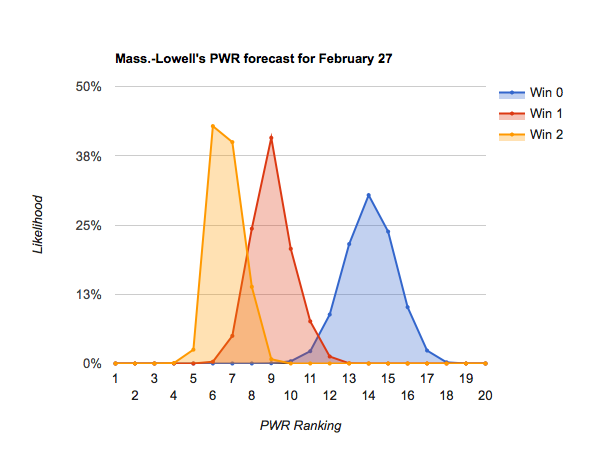
#18 Boston College has a similar opportunity facing #8 Mass.-Lowell for a home-and-home series. Sweeping would provide a broad range of possible outcomes, from #8-#15 quite possible. Getting swept would likely result in a modest decline to the 19-20 range.

Biggest downside potential

As past readers of these articles know, just as teams around #20 usually have the most upside potential, teams around #10 usually have the most potential to fall.

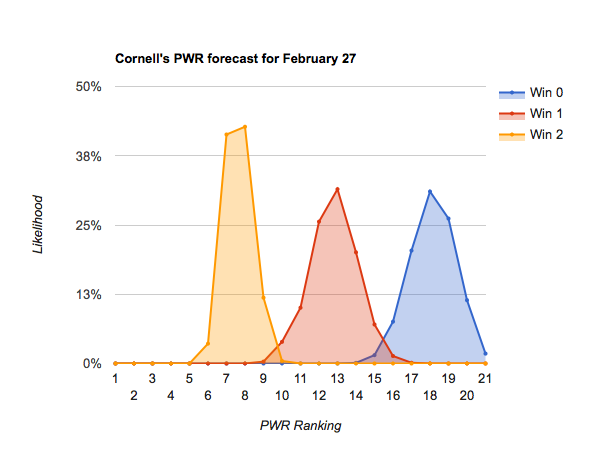
#10 Cornell faces the most downside potential, with ranks 15-21 possible if swept by Rensselaer and Union. Given that these are the last two games of the regular season for Cornell, that would put the Big Red firmly on the bubble.

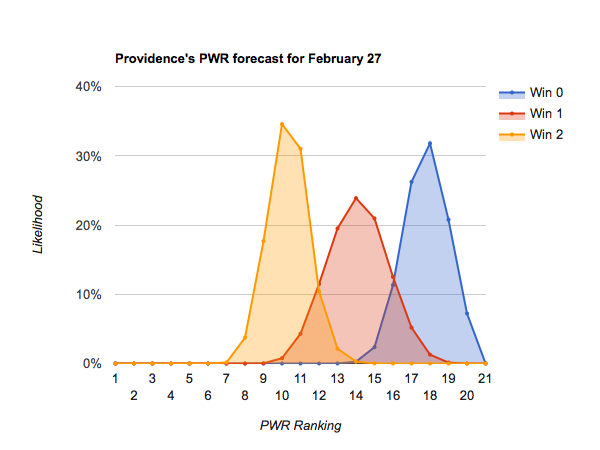
#9 Providence faces a similar outlook, with ranks 15-20 possible with a pair of losses to Massachusetts.

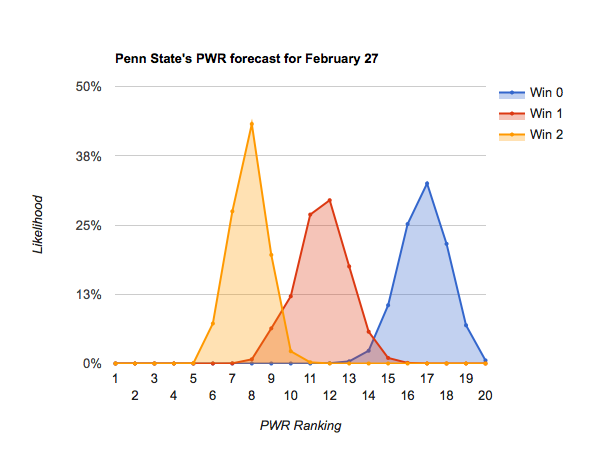
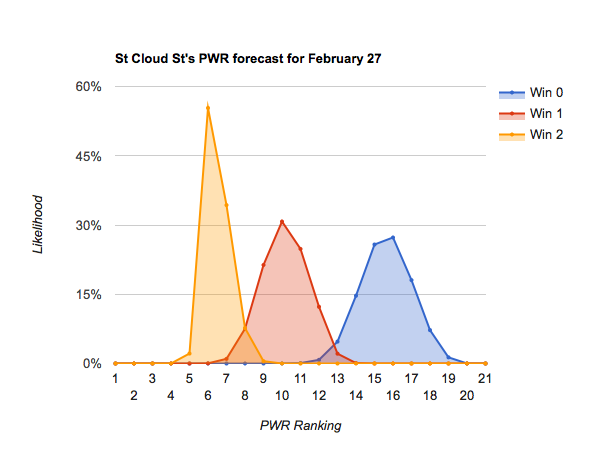
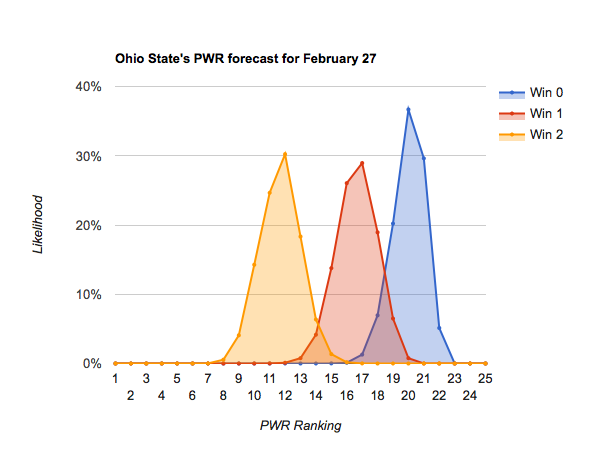
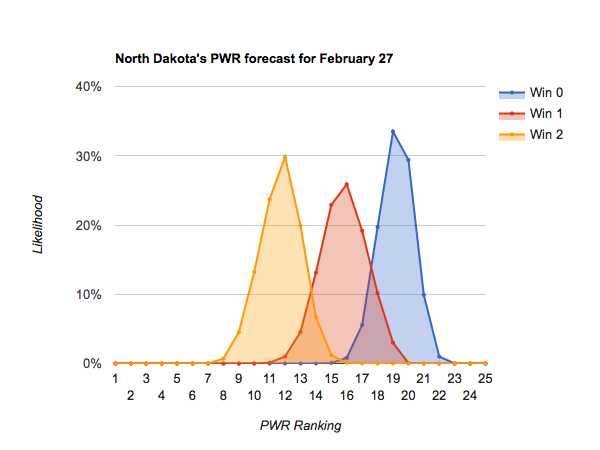
All of #8 Mass.-Lowell, #11 Penn State, #12 St Cloud St, #13 Ohio St, and #14 North Dakota face similar chances of a slightly more modest plunge with a pair of losses. Only Mass.-Lowell’s regular season ends this weekend, so others would have some opportunity to recover.

Top seeds?

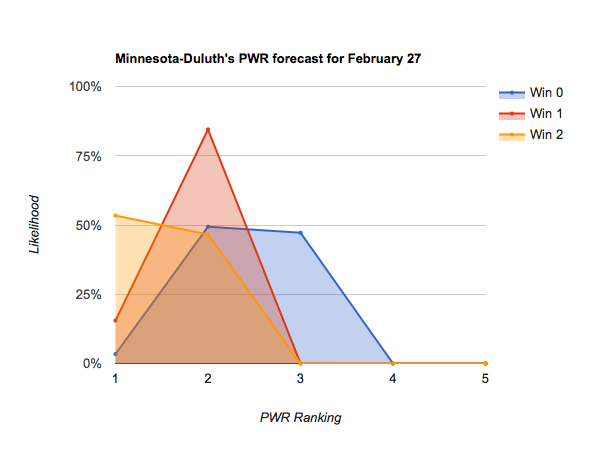
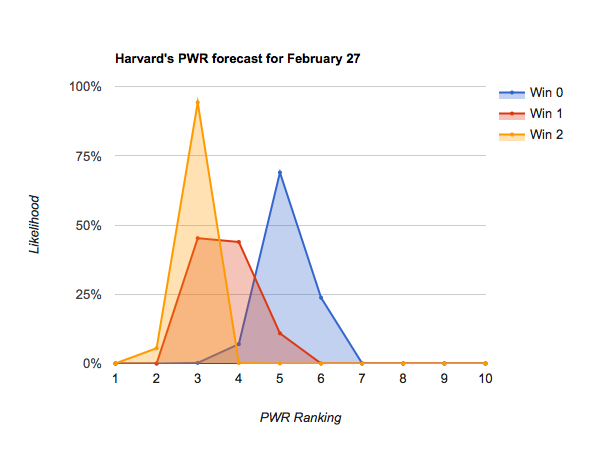
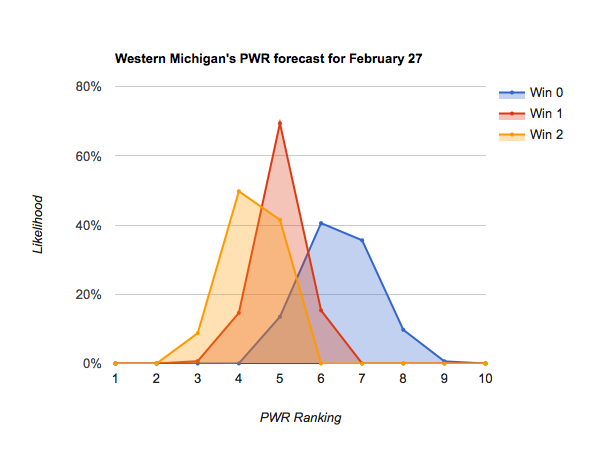
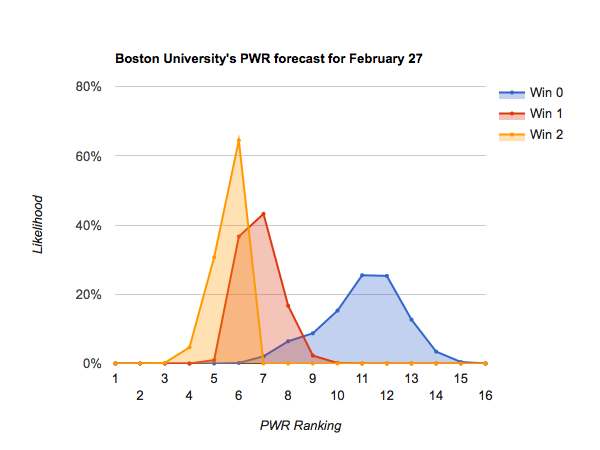
#1 Denver and #2 Minnesota-Duluth each look unlikely to leave the weekend outside of the 1-3 range, regardless of outcome, and one of the two is almost certain to come out #1. Denver doesn’t quite control its own destiny, as Minnesota-Duluth stands about a 10% chance of sneaking into #1 even if both sweep. Other teams fighting for spots in the top 4 this weekend are #3 Harvard, #4 Minnesota, #5 Western Michigan, and #6 Boston University.

Methodology

Forecasts include the results of games played through Tuesday of this week.

Each forecast is based on at least one million monte carlo simulations of the games in the described period. For each simulation, the PairWise Ranking (PWR) is calculated and the results tallied. The probabilities presented in the forecasts are the share of simulations in which a particular outcome occurred.

The outcome of each game in each simulation is determined by random draw, with the probability of victory for each team set by their relative KRACH ratings. So, if the simulation set included a contest between team A with KRACH 300 and team B with KRACH 100, team A will win the game in very close to 75% of the simulations. I don’t simulate ties or home ice advantage.

Resources

Who’s in position for the NCAAs with four weeks left in the regular season?

With most conferences having just four weeks of games remaining before their tournaments begin (the Big Ten has five), the field is tightening up a bit compared to my first look at the cutlines.

Still, no one is mathematically a lock — leaving the regular season in the 10-14 range, as is possible for even the top teams, is not safe because each can accumulate two additional losses and no wins in the conference tournament (only in the Big Ten conference tournament is the worst case scenario exiting immediately with a single loss and no wins).

#1 Quinnipiac
#2 St Cloud St
#3 North Dakota
#4 Boston College
#5 Providence
#6 Michigan
#7 Notre Dame
#8 Boston University
#9 Nebraska-Omaha
#10 Yale
#11 Harvard
#12 Denver

Through #12 Denver should be safe for an at-large bid unless they slump and sink below .500 in their remaining games. Teams near the top have more margin for mistakes than near the bottom.

qu

denver

From #13 Mass.-Lowell through #26 Minnesota-Duluth can position themselves for an at-large bid, with those near the bottom requiring near perfect records.

#13 Mass.-Lowell
#14 Cornell
#15 Penn St
#16 Dartmouth
#17 Clarkson
#18 Michigan Tech
#19 Robert Morris
#20 Rensselaer
#21 Minnesota St
#22 Minnesota
#23 Bowling Green
#24 Miami
#25 St. Lawrence
#26 Minnesota-Duluth

masslowell

umd

#27 Northeastern and below would need near perfection and some luck to sneak into position for an at-large bid. Even then, success in the conference tournament would be required to not fall out of position. These teams should plan to do well in their conference tournaments.

#27 Northeastern
#28 Ferris St
#29 Union
#30 Northern Michigan
#31 Air Force
#32 Holy Cross
#33 Bemidji St
#34 New Hampshire
#35 Vermont
#36 Western Michigan
#37 Ohio St
#38 Wisconsin
#39 Mercyhurst
#40 RIT
#41 Merrimack
#42 Bentley
#43 Connecticut
#44 Colgate
#45 Massachusetts
#46 Alaska Anchorage
#47 Michigan St
#48 Maine
#49 Colorado College
#50 Army
#51 Lake Superior
#52 Princeton
#53 Brown
#54 Sacred Heart
#55 Canisius
#56 Alaska
#57 Alabama-Huntsville
#58 Niagara
#59 Arizona St
#60 American International

northeastern

These lines are approximate because it’s entirely possible for a currently lower ranked team to have a better chance of a higher finish than a higher ranked team. Individual teams’ records, remaining games, and opponents can result in different potentials. For example, most of the teams in the 30s have literally no chance of rising onto the bubble, see #35 Vermont, but then you occasionally stumble across a chart like #36 Western Michigan.

vermont

westernmichigan

Methodology

Forecasts include the results of games played through Tuesday of this week.

Each forecast is based on at least one million monte carlo simulations of the games in the described period. For each simulation, the PairWise Ranking (PWR) is calculated and the results tallied. The probabilities presented in the forecasts are the share of simulations in which a particular outcome occurred.

The outcome of each game in each simulation is determined by random draw, with the probability of victory for each team set by their relative KRACH ratings. So, if the simulation set included a contest between team A with KRACH 300 and team B with KRACH 100, team A will win the game in very close to 75% of the simulations. I don’t simulate ties or home ice advantage.

Resources

Last weekend of February tournament cutlines

As we enter the final full weekend of regular season play (there is some regular season play next weekend, and the Big Ten pushes into the weekend beyond that, but over half the remaining regular season games occur this weekend), I want to remind readers that these forecasts will be through the end of the regular season only.

Conference tournaments don’t provide a lot of downside risk, because they tend to be single elimination (the notable exception being that it’s possible to go 0-2 in conference play in conferences with play-in series). However, there can be significant upside opportunity because teams in conferences with play-in series can put together something like a 4-1 run (a perfect record in conference play would earn the autobid, thus rendering the final PWR ranking unimportant).

Because of those games remaining to be played, I loosely define ending the regular season ranked 13-17 as “on the bubble”. Teams in those rankings can secure an autobid with a decent conference tournament performance.

#7 Denver is the highest ranked team with a decent chance of falling to the bubble if they slump.

denver

#10 Minnesota and below actually need to do pretty well (e.g. above .500) to avoid falling to the bubble (note this chart was made before last night’s win).

Minnesota

Former top-ranked #18 Harvard and below need good performances to climb onto the bubble.

Harvard

Though it’s unlikely that #23 Robert Morris will climb into contention, #24 Western Michigan, #25 Bemidji State, and #26 Penn State are long shots if they win out.

robertmorris

westernmichigan

bemidjistate

pennstate

#27 Dartmouth and below are unlikely to make the NCAA tournament without significant success in their conference tournaments.

dartmouth

Methodology

Forecasts include the results of games played through Sunday of this week, unless otherwise noted.

Each forecast is based on at least one million monte carlo simulations of the games in the described period. For each simulation, the PairWise Ranking (PWR) is calculated and the results tallied. The probabilities presented in the forecasts are the share of simulations in which a particular outcome occurred.

The outcome of each game in each simulation is determined by random draw, with the probability of victory for each team set by their relative KRACH ratings. So, if the simulation set included a contest between team A with KRACH 300 and team B with KRACH 100, team A will win the game in very close to 75% of the simulations. I don’t simulate ties or home ice advantage.

Resources

Big PWR game of the week

The big PWR game of the week is #14 Yale vs. #10 Quinnipiac. They only play one game vs. each other, but then another each vs. #56 Princeton and #48 Brown, respectively.

A single win this weekend for either most likely results in a small decline in ranking. The interesting outcome is if the loser of the head-to-head also loses their other game, which could result in falling of at-large bid position in the PWR.

yale

quinnipiac

The runner-up big PWR game is #23 Western Michigan vs. #2 North Dakota. North Dakota isn’t moving much, even if they get swept; it doesn’t seem possible to overtake idle #1 Minnesota State this weekend. However, Western Michigan could jump just below the bubble with a sweep.

westernmichigan

northdakota

Methodology

Forecasts include the results of games played through Sunday of this week, unless otherwise noted.

Each forecast is based on at least one million monte carlo simulations of the games in the described period. For each simulation, the PairWise Ranking (PWR) is calculated and the results tallied. The probabilities presented in the forecasts are the share of simulations in which a particular outcome occurred.

The outcome of each game in each simulation is determined by random draw, with the probability of victory for each team set by their relative KRACH ratings. So, if the simulation set included a contest between team A with KRACH 300 and team B with KRACH 100, team A will win the game in very close to 75% of the simulations. I don’t simulate ties or home ice advantage.

Resources

Tournament cutlines and weekend PWR outlook

Welcome new visitors. You might want to start with my introductory post, Hello world, to see what this blog is about. It may not be for everyone.

Review of last week’s cutlines

I don’t report on the cutlines (the rankings above which teams are locks for the tournament and below which teams are unable to make the tournament at-large) weekly, because their movements are usually pretty intuitive. If I reported that a team needs to win 5 out 8 and it subsequently wins 2 games, it then needs to win 3 out of 6; the PWR curves usually look about same, just the curve labels change from “5 more wins” to “3 more wins” and so forth. To illustrate that, let’s quickly review a few of the teams that had charts in last week’s article (you may want to open its charts side-by-side for comparison if you can).

By winning 2 games, #4 Minnesota-Duluth made the old “win 0” curve drop off and now just needs 1 or 2 more wins to stay on or above the bubble.

minnesotaduluth_endofseason

#5 Bowling Green also won 2 games, so now just needs about 4 wins to go into conference tournaments on the bubble.

bowlinggreen_endofseason

Further down the chart, #14 Minnesota shifted all of its curves with a pair of wins — the Gophers now need about 6 or 7 wins out of 10 (consistent with last week’s 8 or 9 out of 12) to climb onto the bubble before conference tournaments.

minnesota_endofseason

#30 Bemidji State, which I said last week could only afford about 2 losses, has racked up 2 losses. They would pretty much need to win out for a shot at an at-large bid.

bemidjistate_endofseason

Interesting potential movements this weekend

First, is this the week #1 Minnesota State falls out of first? It only seems possible if they get swept (which KRACH gives about a 2.6% chance of happening), and even then someone nipping at their heels (North Dakota seems the only possibility) has to do well. You can’t see the “Win 1” curve because it’s in exactly the same place as “Win 2″—100% at 1.

mankato

The matchup of the weekend is definitely #12 Michigan vs #14 Minnesota. Neither has much upside potential, but if either sweeps the other will plummet up to 10 spots.

michigan minnesota

#15 Mass.-Lowell needs a sweep to hang on, but pair of losses could send them into the twenties.

masslowell

Remember when #16 Harvard was ranked 1st and I said that a “not particularly likely” bad 2nd half could still push them out? Two more losses this weekend could push them into the twenties.

harvard

#22 St Cloud State, mentioned last week as the lowest ranked team with a good chance of climbing into contention, can make up some ground this weekend. An unlikely sweep of #5 Minnesota-Duluth could catapult them up onto the bubble, while even a split could result in a climb of a position or two.

stcloudst

#26 Western Michigan is also poised for huge jump with an also unlikely sweep over #4 Nebraska-Omaha.

westernmichigan

Methodology

Forecasts include the results of games played through Sunday of this week, unless otherwise noted.

Each forecast is based on at least one million monte carlo simulations of the games in the described period. For each simulation, the PairWise Ranking (PWR) is calculated and the results tallied. The probabilities presented in the forecasts are the share of simulations in which a particular outcome occurred.

The outcome of each game in each simulation is determined by random draw, with the probability of victory for each team set by their relative KRACH ratings. So, if the simulation set included a contest between team A with KRACH 300 and team B with KRACH 100, team A will win the game in very close to 75% of the simulations. I don’t simulate ties or home ice advantage.

Resources