Category Archives: forecasts


With one weekend before conference tournaments begin, who’s positioned for an at-large NCAA bid?

With just one weekend of play remaining until the first conference tournament begins, we know a lot more about who is likely to get an at-large bid to the NCAA tournament than we did even just a couple weeks ago.

Follow along, if you’d like:
Wins needed to likely end regular season at PWR rank

Remember that any team that wins its conference tournament gets an autobid. Because we don’t know how many tournament slots will go to autobids that wouldn’t have made the tournament at-large, we can’t be sure what PWR ranking will be required to make the tournament at-large, but it’s likely to be in the 13-14 range. So, we’re primarily looking for the likelihood of teams that don’t win their conference tournaments finishing around #13-14 (or higher), but will call anything in the 12-15 range “the bubble” because of the uncertainty.

Near locks

#1 St Cloud State through #8 Arizona State are probably in, no matter how they perform. Note that there are some unlikely scenarios in which teams like #7 Ohio State, #5 Denver, and even #3 Minnesota-Duluth can fall to the teens by the end of the regular season, which would open the door for missing the tournament with a subsequently poor performance in the conference tournament and some extremely bad luck. But, that’s unlikely.

#8 Arizona State is actually a bit safer than those teams by virtue of not having a conference tournament in which they could perform poorly and push themselves lower.

Those teams include:
#1 St Cloud St
#2 Massachusetts
#3 Minnesota-Duluth
#4 Minnesota St
#5 Denver
#6 Quinnipiac
#7 Ohio St
#8 Arizona St

Likely in control of their own destiny

#9 Northeastern through #14 Harvard can come close to locking up an at-large bid with a strong finish, but would still be on the bubble even with a disastrous finish. Then, it would come down to conference tournament performance and quite a bit of luck around other teams’ performances to determine who gets the at-large bids.

Those teams include:
#9 Northeastern
#10 Providence
#11 Western Michigan
#12 Clarkson
#13 Cornell
#14 Harvard

I debated a bit whether to include Harvard in this list or the next, they’re right on the margin. There are scenarios, though not the most likely, in which even with a pair of wins Harvard could end the regular season around #13.

At-large bids are possible

#15 Bowling Green through #19 Penn State could make the tournament at-large with a near perfect close to the season, a decent conference tournament performance, and some luck.

Those teams include:
#15 Bowling Green
#16 Mass.-Lowell
#17 Notre Dame
#18 North Dakota
#19 Penn State

Probably need to win their conference tournament

None of #20 Lake Superior, or below, can end the regular season in the top 16. So, it would take an improbably strong conference tournament performance and some luck to get an at-large bid (remember that winning the conference tournament guarantees an autobid, so the at-large bid would only come into play with a loss in the conference tournament, which would likely also have pushed down the PWR ranking a bit).

Will Arizona State make the NCAA hockey tournament?

#9 Arizona State has been the talk of the NCAA hockey tournament prognostication community in 2019. In their third year in D-I, the Sun Devils (19-10-1) are aiming to be the first independent team to earn an at-large tournament bid since Alaska-Anchorage in 1992. They are #9 in the PairWise Rankings (PWR) that mimic the NCAA’s tournament selection process. Their potential movement from that position is limited by having just 4 regular season games remaining and by not playing in a conference tournament (which, by the nature of tournament design, tend to be a drag on the PWR of teams that don’t win).

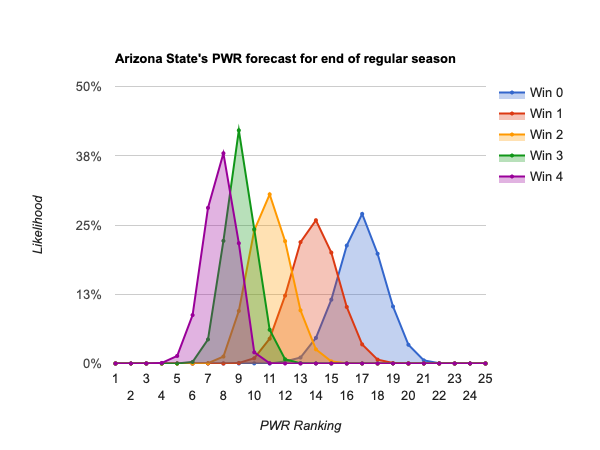
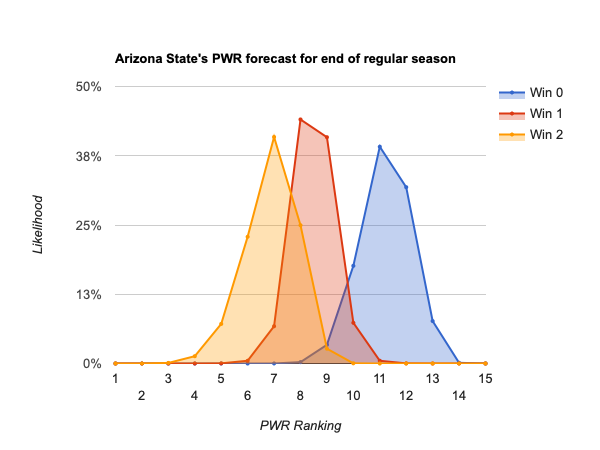
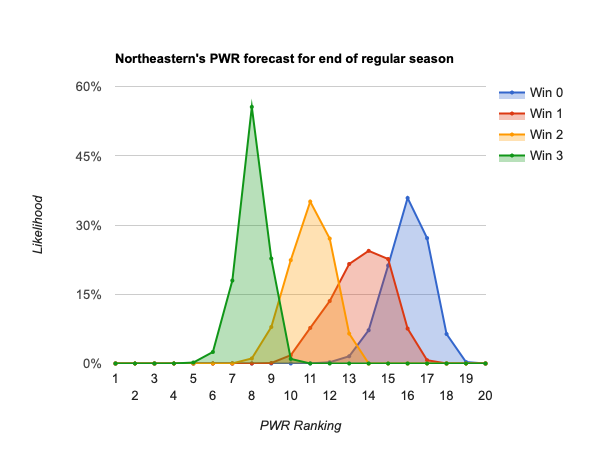
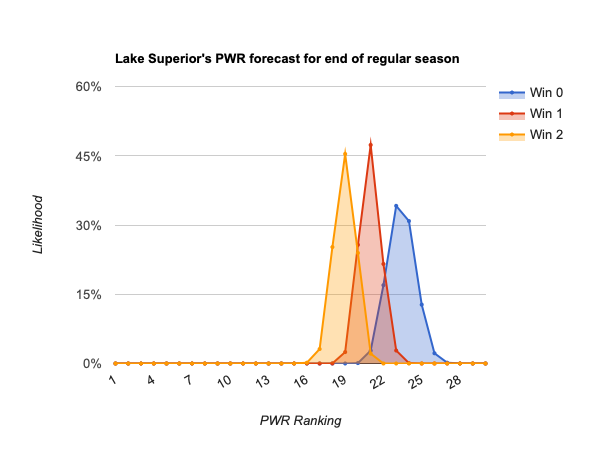
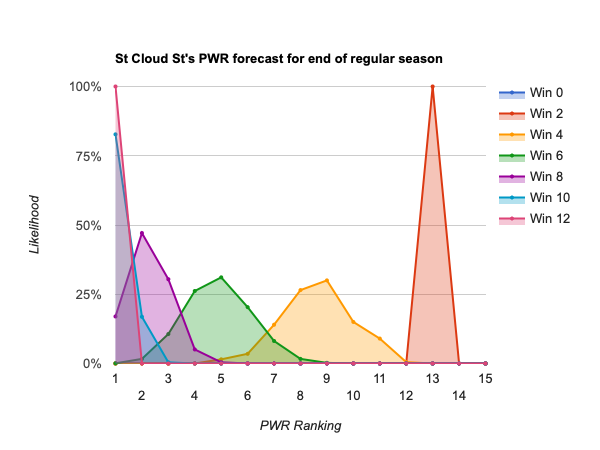
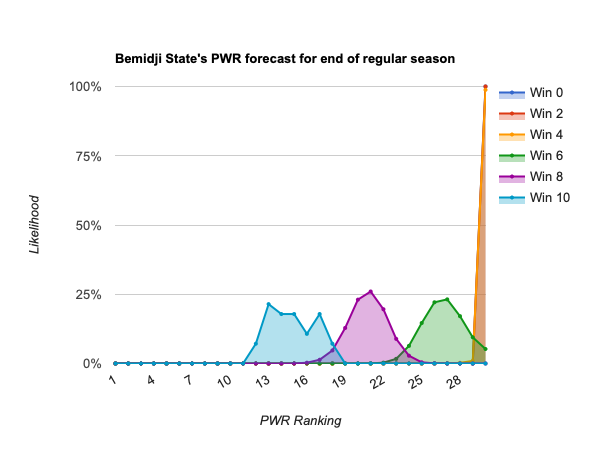
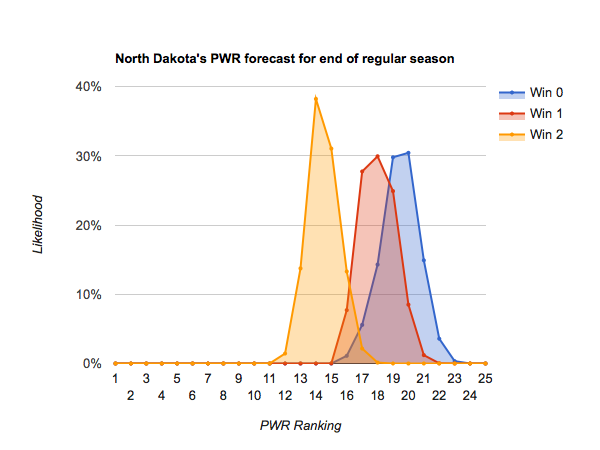
With so much NCAA hockey left to be played, the Sun Devils do not control their own fate. Arizona St could make, or miss, the tournament in any of their remaining potential season outcomes–from winning none of their 4 remaining games to winning all. But, their own performance across those 4 games does have a huge influence over which fate is most likely. Based on PWR simulations through the end of the regular season, here’s how Arizona State is likely to fare based on its own performance in its remaining games (summarized from Arizona St’s PWR Forecast page):

4 wins gives Arizona St just short of a mathematical lock on an at-large NCAA tournament invitation, with a likely end of season PWR between 6 and 9.

3 wins probably lands Arizona St between 7 and 11 at the end of their season, with the midpoints of 8-10 most likely. That would be very nearly a lock for the Sun Devils, as a huge downward plunge is very unlikely while idle, and it would take bad luck in the conference tournament results for the top 12-13 not to make the NCAAs.

2 wins probably lands Arizona St between 9 and 13 at the end of their season, with the midpoints of 10-12 most likely. In this scenario, the Sun Devils are still most likely to make the NCAAs. They need just a little bit of luck to make sure that they either land near the middle or top of that range or that most conference tournaments are won by high ranking teams (thus ensuring that #12-#13 in PWR get at-large bids).

With just 1 more win, Arizona State could find itself anywhere from #11-#17 at the end of their season (the range of possible outcomes is larger in this scenario, which is more dependent on other teams’ performance in the tight RPI range of teams 12-18). Making the tournament in this scenario is still entirely possible, as Arizona St has a greater than 65% of finishing #14 or higher even with just 1 more win. But, they would be firmly on the bubble with their fate in the hands of the cutline (that is, the lowest PWR rank that gets an at-large bid varies based on how many conference tournament autobids are won by lower ranking teams).

There are even remote scenarios in which Arizona State makes the tournament with no additional wins. In 1% of 0 win scenarios, the Sun Devils end up with a #13 PWR. In 4.6%, they end up #14. Those are long shot outcomes with no wins, on which the Sun Devils would need particular conference tournament results to get in from #13-#14, but are quite possible.

More math, please!

The above describes the most likely outcomes, based on simulations of all 181 games left in all teams’ regular seasons, so most accurately captures the effects that other teams’ outcomes might have on the Sun Devils. But, to better understand why Arizona State’s PWR will move based on its own outcomes, we can dive deeper into the PWR, and in particular RPI.

Playing with the PWR Calculator, winning any two of its remaining games (but losing the other two) lands Arizona State at #11.

Looking at the Arizona St PWR Details page, that outcome is reasonably predictable. Arizona St’s won comparisons to each Western Michigan and Mass.-Lowell can be flipped by flipping RPI alone, which is pretty close for all three:

  • Arizona St .5581
  • Western Michigan .5548
  • Mass.-Lowell .5531

To give you some idea of the magnitude of those numbers, the Arizona St RPI Details page reveals the approximate potential effects on Arizona State’s RPI of their remaining games:

  • Each win vs American International +.0027
  • Each win at Minnesota +.0034
  • Each loss vs American International -.0065
  • Each loss at Minnesota -.0047

(If you’re double-checking me on a cocktail napkin, you might note that the numbers above would result in Arizona State’s RPI being just slightly, .001, higher than Mass.-Lowell’s in its win 2 vs. American Int’l/lose 2 at Minnesota scenario. That’s because the RPI effects table isolates individual games so can’t be used to precisely calculate the effect of multiple outcomes and their effects on other teams; but, the PWR Calculator does an exact calculation for a scenario of any complexity and confirms that, all other things unchanged, Arizona State’s RPI would come out slightly below Mass.-Lowell’s once all the side effects of those games are included).

Again, starting with the PWR Calculator, winning 3 or 4 wouldn’t result in a climb for Arizona State (with no other games played) because there’s no easily flippable comparison above Arizona St. Though #8 Cornell only has a .5598-.5581 RPI lead, it wins the comparison 4-0, so flipping RPI alone wouldn’t flip the comparison. The comparison to #7 Denver hinges on RPI, but the Pioneers’ RPI of .5711 has a formidable gap over Arizona State’s .5581 (the game contribution RPIs from the section above show that 4 wins can move Arizona State’s RPI close to Denver’s, but it turns out not close enough).

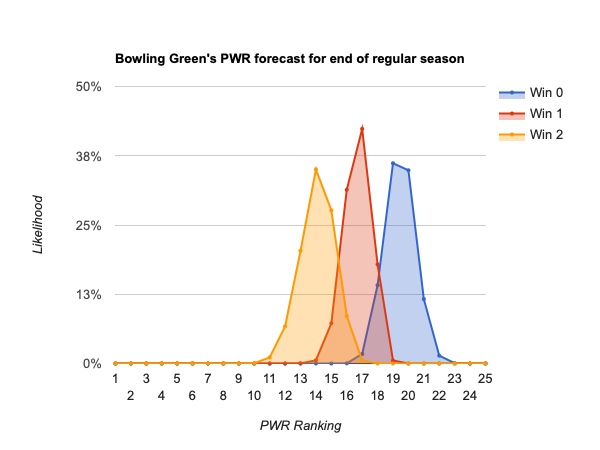
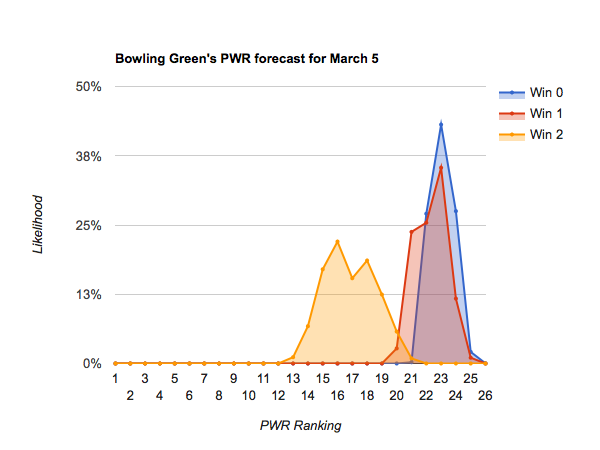
Going back to the PWR Calculator, if Arizona State only wins 1, they will fall to #14 (with no other games played). That’s not surprising looking at it’s PWR Details page, because the Sun Devils are sitting atop a heap of 1-0 comparisons won by a reasonably tight RPI (#15 Bowling Green has an RPI of .5411).

Finally, one last visit to the PWR Calculator reveals that with no additional wins, Arizona State would fall to #18 (if no other NCAA teams played any additional games). Remember from our earlier look at Arizona St’s PWR details page that #12 Clarkson through #18 Notre Dame are separated by only .0107 in RPI, and that Arizona State’s PairWise Comparison win over each would flip away from the Sun Devils with a flip in RPI ranking.

I jumped to the bottom to find out if they’d make the tournament or not!

Probably. Like over a 99% likelihood if they win 3 or 4 of their remaining games. More likely than not if they win 2. A real tossup if they win 1. And in the neighborhood of 3% if they win 0.

Interesting PWR games of the week-North Dakota, Providence, and Cornell

Who doesn’t find themself looking at the PairWise Ranking (PWR) each week? (Ok, very few of us do, but I have a feeling you might be among the select few). While a lot of the tools and analysis here focus on the end of season and who’s going to make the NCAA tournament, it’s also sometimes fun to look at the week-to-week ebb and flow.

You can always use the PWR calculator to find out for yourself what would happen with just a few games’ results determined, e.g. what would St. Cloud St’s PWR be if its weekend results were already in. But, using the same simulations I use for end-of-season projections, focusing on just one week’s results, can provide a more nuanced answer to the same question. If the calculator tells you “what would St. Cloud St’s PWR be with nothing changed but this weekend’s results being set”, the simulations tell you “what is St. Cloud St’s PWR likely to be after all teams’ games this weekend are completed?” Got it?

One more programming note–it’s not uncommon to see teams in the 40s have one week upside potential in the range of 10 spots. Those generally require an improbable sweep of a much higher ranked team, and even if completed, don’t result in the team being anywhere near the bubble. I include a game as interesting only if it involves a team that has a notable chance of making the NCAAs at large.

Upside potential: #20 North Dakota

A stretch of tough competition provides PWR opportunities for #20 North Dakota. After the Fighting Hawks earned a much needed split against #1 St Cloud St last weekend, they are now at the bottom of a PWR hill going into a pair of games at #6 Denver this weekend. By the current rankings, UND “should” lose those road games at a ranked opponent, so any success will push the Hawks upward, while failure won’t result in much of a fall (though UND can’t afford to squander such an opportunity to climb at this point).

A pair of wins would most likely shoot UND into the #12-#16 range, with a break into the single digits unlikely, but mathematically possible. A split would most likely result in a modest climb to the #16-#19 range. Going into games you’re expected to lose results in very little downside risk, as even getting swept would likely leave the Hawks in the #19-#22 range.

Using the PWR Calculator, you can see that if no other games were played this weekend, a pair of wins would land UND at #12, a split at #17, and a pair of losses at #20.

Downside potential: #10 Providence, #9 Cornell

#10 Providence faces the opposite situation from UND, hosting #39 Vermont for a pair of games this weekend. The Friars are at the most treacherous PWR ranking, where RPIs start to become pretty compressed, numerous PWR comparisons are won by 1, and your resume doesn’t really look that different from the team 10 spots below you. Providence is supposed to win; a sweep won’t help their ranking, but underperforming could result in a sharp fall.

A pair of wins would most likely keep Providence in the #9-#12 range. A split would likely result in a modest fall to the #12-#16 range. Getting swept in a pair of games the Friars are supposed to win could be catastrophic, most likely resulting in a PWR anywhere in the #14-#20 range.

Using the PWR Calculator, you can see that if no other games were played this weekend, a pair of wins would land PC at #9, a split at #14, and a pair of losses at #17.

The narrative for #9 Cornell is the same as Providence’s, but with a pair of road games at #19 Union and #49 Rensselaer.

A pair of wins would most likely keep Cornell in the #7-#10 range. A split would likely result in a modest fall to the #9-#15 range. Getting swept in a pair of games they’re supposed to win would result in a fall for the Big Red, likely to anywhere in the #13-#19 range.

Using the PWR Calculator, you can see that if no other games were played this weekend, a pair of wins would land Cornell at #8, winning either but losing the other at #11, and a pair of losses at #17. Surprisingly, there doesn’t seem to be a big difference between losing to #19 Union or #49 Rensselaer.

How it works

Each forecast is based on at least one million monte carlo simulations of the games in the described period. For each simulation, the PairWise Ranking (PWR) is calculated and the results tallied. The probabilities presented in the forecasts are the share of simulations in which a particular outcome occurred.

The outcome of each game in each simulation is determined by random draw, with the probability of victory for each team set by their relative KRACH ratings. So, if the simulation set included a contest between team A with KRACH 300 and team B with KRACH 100, team A will win the game in very close to 75% of the simulations. I don’t simulate ties or home ice advantage.

The calculator uses the same PWR formula that mimics the NCAA’s tournament selection process that is used to produce the PWR tables on this and many other sites. But, in addition to running the formula against the games that have already been played, it lets you test scenarios by seeing what the PWR would be with different results for existing games, new results for not-yet-played games, or entirely fictitious games.

A first look at which teams are likely to make the NCAA hockey tournament

With most teams having just 10-12 regular season games remaining, we can draw some conclusions about who’s likely to make the NCAA tournament. In this article, I’ll look at the regular season forecasts (see First 2019 PWR forecast available for an explanation, if you’re not familiar) to discuss how teams need to perform in their remaining games to earn an NCAA tournament berth.

You can also always browse the weekly forecast yourself at PWR by wins forecast.

Who’s a lock?

No one is mathematically a lock at this point, but in 1,000,000 simulations of the rest of the regular season, there wasn’t a single one in which #1 St. Cloud St won fewer than 2 games or dropped below #13 PWR. Of course, those simulations include assumptions about the Huskies’ strength based on their performance so far, so it’s possible that an unprecedented collapse could result in a tournament miss. But, based on their performance to date, I’ll say St. Cloud St is the one team positioned to be assured a tournament berth.

Who’s in barring a collapse?

Even #2 Massachusetts doesn’t have quite as guaranteed a path. Winning just 4 games could result in a regular season PWR in the 10-15 range, which is right on the bubble of making an at-large NCAA tournament berth.

Down through about #7, Northeastern, teams will finish on or above the bubble by winning half their remaining games. Those teams include:

#2 Massachusetts
#3 Denver
#4 Minnesota-Duluth
#5 Ohio State
#6 Quinnipiac
#7 Northeastern

Who controls their own destiny?

From #8 Minnesota State down to #30 Wisconsin control their own destiny. That is, they can each end up on the bubble, or better, with a sufficiently good performance over the rest of the regular season. The lower the current ranking, the better a performance is required. For example, Wisconsin would really need to win out 11 or 12 of its remaining 12 games for the Badgers to be well positioned for an at-large berth.

Those teams include:

#8 Minnesota State
#9 Cornell
#10 Clarkson
#11 Arizona St
#12 Bowling Green
#13 Western Michigan
#14 Notre Dame
#15 Union
#16 Providence
#17 Harvard
#18 Penn St
#19 Mass.-Lowell
#20 Lake Superior St
#21 North Dakota
#22 Northern Michigan
#23 Yale
#24 Boston U
#25 Minnesota
#26 Michigan St
#27 Michigan
#28 New Hampshire
#29 Miami
#30 Wisconsin

Who won’t make the tournament at large?

From #31 Bemidji St down, there aren’t many possibilities of climbing to the bubble. A few seem to have the possibility of climbing to the bottom of the bubble, the 13-15 range, if they win out; but, even such a performance would still be pretty unlikely to result in an at-large tournament berth with a loss in the conference tournament. If you wanted to make a super long shot bet on one of these, #31 Bemidji St, #32 Dartmouth, #33 RIT, #34 Maine, #39 Boston College, and #41 Nebraska-Omaha stand the best chance.

But, all of these teams should really plan to win their conference tournament if they want to make the NCAAs:

#31 Bemidji St
#32 Dartmouth
#33 RIT
#34 Maine
#35 Michigan Tech
#36 Colorado College
#37 Air Force
#38 American International
#39 Boston College
#40 Princeton
#41 Nebraska-Omaha
#42 Niagara
#43 Vermont
#44 Mercyhurst
#45 Colgate
#46 Rensselaer
#47 Brown
#48 Connectictu
#49 Alaska
#50 Merrimack
#51 Army
#52 Canisius
#53 Bentley
#54 Robert Morris
#55 Sacred Heart
#56 Ferris St
#57 Alabama-Huntsville
#58 Holy Cross
#59 St. Lawrence
#60 Alaska Anchorage

What next?

I’ll keep updating the forecasts weekly, so you can always browse them yourself. I’ll also try to post interesting interpretations here, with increasing frequency as we near the end of the regular season. Meanwhile, you can explore more of the data yourself:

Who can make the NCAAs – Saturday morning outlook

I’ve crunched through the remaining 192 possible outcomes, and here’s what I think happens tomorrow for each team.

In for sure

St Cloud St
Notre Dame
Cornell
Ohio State
Denver
Mankato
Northeastern
Providence
Michigan
Clarkson
Penn State

Can still get autobid by winning conference

Atlantic Hockey – Robert Morris or Air Force
ECAC – Princeton (plays Clarkson, already in)
Hockey East – Boston University (plays Providence, already in)
WCHA – Northern Michigan or Michigan Tech

So at least two conferences will be won by a team that takes an autobid, leaving at most 3 at-large spots. Two additional conferences can be won by teams that wouldn’t otherwise make it, which would leave just a single spot.

Can make it at-large

Minnesota Duluth (plays in consolation game)
Minnesota
North Dakota (plays in consolation game)
Boston College

The following analysis of what each team needs is much more of a pencil and paper exercise than the automated forecasts, so please point out any inconsistencies or inaccuracies.

If neither Boston University nor Princeton win, then there will be three slots remaining. Minnesota and Minnesota Duluth each get one and North Dakota and Boston College will be vying for the final slot. UND gets it with a win or a tie; with a loss, UND can still claim it if Michigan Tech wins.

If just one of Boston University or Princeton win, there will be two spots remaining and Minnesota and Minnesota Duluth will get them and North Dakota and Boston College will be left out.

If both of Boston University and Princeton win, there will only be slot remaining. Again, North Dakota and Boston College will be out, but only one of Minnesota or Minnesota Duluth will be selected. To get the upper hand, Minnesota needs UND and any of SCSU, NMU, OSU, or RMU to win.

How many teams will each conference send to the NCAAs?

Of the remaining possible scenarios that could come out of this weekend’s conference tournaments, here’s a breakdown of the share of scenarios of how many teams each conference sends:

0 1 2 3 4 5 6
Atlantic Hockey 0% 100% 0% 0% 0% 0% 0%
Big 10 0% 0% 0% 2% 23% 75% 0%
ECAC 0% 1% 62% 37% 0% 0% 0%
Hockey East 0% 0% 46% 54% 0% 0% 0%
NCHC 0% 0% 2% 60% 38% 0% 0%
WCHA 0% 0% 100% 0% 0% 0% 0%

Atlantic Hockey

1 team – 100%

No teams from Atlantic Hockey will make the tournament at-large, so only the winner of the conference tournament will make the NCAAs. That will be either #20 Mercyhurst, #43 Robert Morris, #30 Air Force, or #34 Canisius.

Big 10

3 teams – 2%
4 teams – 23%
5 teams – 75%

Notre Dame, Ohio State, and Michigan are guaranteed to make the NCAAs. The Big Ten’s representation won’t be increased by the conference tournament’s winner, as the winner will be one of Notre Dame or Ohio State.

Penn State and Minnesota are both idle and both stand a pretty good chance of making the NCAAs (in 98% and 76% of scenarios, respectively). Because both are idle, there is significant overlap between Penn State and Minnesota making the tournament (both need conference tournaments won by high PWR teams to move the cutline and poor performance by other teams in search of an at-large bid, such as North Dakota). Because of that, The Big Ten puts all 5 possible teams in the NCAAs in 75% of remaining scenarios.

ECAC

1 team – 1%
2 teams – 62%
3 teams – 37%

Only #3 Cornell is guaranteed a tournament appearance, but it’s very unlikely they will be the ECAC’s only representative.

Clarkson is guaranteed an appearance with just one win, and makes the tournament in 73% of scenarios in which they don’t win at all.

Princeton and Harvard can each make the NCAAs by winning the ECAC tournament, but only by winning the ECAC tournament, so both can’t make it.

So, it’s possible, but very unlikely, for Cornell to win the conference tournament and be the only ECAC team to advance. If Clarkson wins the conference tournament, both Cornell and Clarkson will go to the NCAAs. If either of the other two win, the ECAC will have three representatives if Clarkson makes it at-large or two if not.

Hockey East

2 teams – 46%
3 teams – 54%

Providence and Northeastern are guaranteed to make the NCAAs.

If either Boston University or Boston College win the Hockey East tournament, that winner will also advance, giving Hockey East three teams.

There are also a very small number of scenarios in which BC or BU make the NCAAs despite Providence or Northeastern advancing (generally having to do with favorable cutlines and some quirky RPI luck; see How Boston University can make the NCAAs without winning Hockey East for more details).

NCHC

2 teams – 2%
3 teams – 60%
4 teams – 38%

St Cloud St and Denver are guaranteed bids.

While one might guess that #8 Duluth is a lock, especially knowing that #9 Providence and #10 Michigan are, reader of CollegeHockeyRanked – NCAA tournament possibilities know that Duluth misses in about 11% of scenarios in which they lose the semifinal. So, the NCHC advances only 2 teams in about 2% of possible scenarios, or 3 teams in about 60%.

North Dakota also stands some chance of advancing, either by winning the NCHC tournament (25% of possible scenarios) or at-large.

WCHA

2 teams – 100%

Minnesota State is guaranteed a bid.

But, Minnesota State has already been eliminated from the WCHA tournament. Neither of the remaining two teams–Northern Michigan and Michigan Tech–can make the NCAAs at-large. So, the winner is guaranteed to be the WCHAs second team in the NCAAs.

How Boston University can make the NCAAs without winning Hockey East

An example of Boston University making the NCAA tournament at-large (that is, without winning the Hockey East tournament) follows:
https://goo.gl/UJMXKt

Generalizing that individual scenario, two things need to happen for Boston University to make the NCAAs at-large:

  1. Game outcomes need to be such that BU gets pushed up to #14 PWR, despite a loss
  2. Only two conference tournaments can be won by low PWR teams, so the #14 PWR team gets selected at-large

Getting BU to #14

One mandatory outcome for the Terriers to advance without winning the conference tournament seems to be North Dakota losing two games. Any win or tie by the Hawks, even if it doesn’t result in UND getting a bid, eliminates any chance of BU getting an at-large bid.

Beyond that, it takes one of a few particular combinations of outcomes to land BU at #14. There are 41 such combinations in the 12,288 possible outcomes in which Boston University wins the opening game versus Boston College but loses the Hockey East championship.

Getting #14 into the tournament

Even if Boston University gets to #14 in the PWR, as described above, only two conference tournaments can be won by teams ranked #15 or lower for the #14 team to get an at-large bid.

Because the WCHA (#17 Northern Michigan vs #24 Michigan Tech) and Atlantic Hockey (#20 Mercyhurst, #43 Robert Morris, #30 Air Force, and #34 Canisius) can only be won by teams that will finish #14 or lower, all other conference tournaments must be won by teams that finish in the top 14.

That’s guaranteed in the Big Ten, where only #2 Notre Dame and #4 Ohio State are vying for the championship. Also in a Hockey East tournament in which BU doesn’t win, a winner from among #15 Boston College, #9 Providence, and #7 Northeastern is guaranteed to be in the top 14.

So, from the ECAC, #3 Cornell or #11 Clarkson must take the championship rather than #22 Princeton or #26 Harvard. And, in the NCHC, #1 St Cloud St, #5 Denver, or #8 Minnesota Duluth must win (though #14 North Dakota losing is already a mandatory condition to get BU to #14, as stated above).

Summary

To get to #14 but not win the Hockey East championship, Boston University needs to win vs. Boston College but lose the championship game. The Terriers also need some help from North Dakota, which must lose in both the semifinal and consolation games.

Also, for the #14 team to advance to the NCAA tournament, the above must hold and Cornell or Clarkson must win the ECAC tournament.

  • BU wins 1 game, loses championship
  • North Dakota loses two games
  • Cornell or Clarkson wins ECAC tournament

Those conditions leave 1024 remaining possible scenarios, in which 41 of them see BU hold onto the #14 slot and get an NCAA bid.

NCAA tournament possibilities

This article describes what teams might make the NCAA hockey tournament based on the data in the College Hockey Tournament Possibilities table:
College Hockey Tournament Possibilities

Because of a new conference tournament schedule this year, there are only 15 games remaining and thus only 49,152 possible outcomes remaining (the NCHC consolation game can end in a tie). That’s a dramatic simplification from past years, and there are thus few surprises in the possible outcomes.

16 teams make the tournament. The winner of each conference tournament is selected with what I sometimes call an “autobid”, then the remaining slots are filled in order of final PWR rank. Thus, teams that don’t make the tournament with an autobid but end up in “bubble” PWR ranks of 12-15 want conference tournaments won by high ranking teams so there are still slots available for them to get selected at-large. Teams that can’t finish in the top 16 of PWR can only be selected for the NCAA tournament by winning their conference tournaments and getting an autobid.

In

9 teams are guaranteed to make the NCAA tournament regardless of outcome next weekend.

#1 St Cloud St
#2 Notre Dame
#3 Cornell
#4 Ohio St
#5 Denver
#6 Mankato (idle)
#7 Northeastern
#9 Providence
#10 Michigan (idle)

A lock with a win

Minnesota-Duluth and Clarkson both stand a good chance to make the NCAA tournament regardless of outcome (in 89% of scenarios in which they go 0-2 for Duluth and 73% of scenarios in which they lose for Clarkson), but can lock up at-large bids with a single win. If either should lose, they just need enough of the teams above to advance to leave at-large spots available for them.

#8 Duluth
#11 Clarkson

At-large possible

Much like Duluth and Clarkson, these teams hoping for an at-large bid want conference tournaments to be won by teams that have already locked up a bid (above). If a team that wouldn’t otherwise make the tournament wins a conference tournament and gains an autobid, that would leave one fewer at-large slot for these teams.

Penn State is quite likely to advance, in 98% of remaining scenarios. Minnesota faces a more perilous 76% of scenarios remaining that allow the Gophers to advance.

Of course, the 3 teams that are still playing have varying amounts of control over their own destinies:

  • North Dakota gets selected in 14% of scenarios in which they’re winless, 25% of scenarios in which they win 1, and can get an autobid.
  • Boston College faces less favorable 3% and 9% chances with zero or one wins.
  • Boston University can’t make it without a win, and even with 1 win faces a tiny chance of being selected at-large (under 1% of scenarios in which they win just 1 game).

#12 Penn St (idle)
#13 Minnesota (idle)
#14 North Dakota
#15 Boston College
#18 Boston University

Need to win the conference tournament

#17 Northern Michigan
#20 Mercyhurst
#22 Princeton
#24 Michigan Tech
#26 Harvard
#30 Air Force
#34 Canisius
#43 Robert Morris

March 9-11 weekend PWR outlook

This article discusses who is likely to make the NCAA tournament based on potential outcomes this weekend. It’s largely based on the following forecast:
Wins needed to emerge at PWR rank

Now that we’re in conference tournament play, note that the forecast is for one week.

Near locks for the NCAA tournament

It would take highly unlikely (though not mathematically impossible!) bad luck for any of the current top 6 to miss the NCAA tournament.

#1 St Cloud through #6 Denver should emerge from the weekend in the top 8, even if they fail to advance. It would be exceedingly unlikely for any of them to then fall to #12 or below while idle AND have conference tournaments won by enough low ranked teams that teams in the #12 range fail to make the NCAA tournament at-large.

#1 St Cloud St
#2 Nore Dame
#3 Cornell
#4 Ohio St
#5 Minnesota St
#6 Denver

Almost a lock?

A similar case can be made for #7 Michigan, who should fall between #7-#12 if they lose. But, it’s just possible enough to hit #12 (or below) and miss that I don’t yet dare call the Wolverines a lock.

#7 Michigan

Control their own destiny

#8 Clarkson through #12 Providence can drop to the bubble with loss(es), or position themselves well with win(s). None of these teams would be outright eliminated if they fail to advance this weekend, but would become dependent on others’ performances and some luck.

#8 Clarkson
#9 Minnesota-Duluth
#10 Northeastern
#11 Penn St
#12 Providence

Watching from the sidelines

#13 Minnesota has already been eliminated from the Big Ten tournament, so is not playing this weekend, and is likely to emerge from the weekend between #10-14. Nothing is likely to change for the Gophers this weekend–they’re not yet eliminated, but will be dependent on others’ performances and some luck.

#13 Minnesota

Need to win

It’s tough to imagine #14 Nebraska-Omaha or below making the NCAA tournament unless they advance this weekend. The Mavericks show some chance of emerging #15, with a slim remaining chance of an at-large bid, from a winless weekend; but even that hope doesn’t seem to extend to #15 North Dakota and below.

How it works

Each forecast is based on at least one million monte carlo simulations of the games in the described period. For each simulation, the PairWise Ranking (PWR) is calculated and the results tallied. The probabilities presented in the forecasts are the share of simulations in which a particular outcome occurred.

The outcome of each game in each simulation is determined by random draw, with the probability of victory for each team set by their relative KRACH ratings. So, if the simulation set included a contest between team A with KRACH 300 and team B with KRACH 100, team A will win the game in very close to 75% of the simulations. I don’t simulate ties or home ice advantage.

Resources

Conference tournament play-in weekend outlook

With all conferences except the NCHC in the opening round of conference playoffs, many teams have the weekend off while others play in a best-of-3 play-in series.

Here’s where teams could end up after this weekend’s play:
PWR Forecast By Wins

View from the top

#1 St Cloud St isn’t going anywhere. Even though the Huskies play a pair of games, #2 Notre Dame and #3 Cornell are idle so can’t do enough to overtake St Cloud. They’re also both nearly guaranteed to stay in the top 4.

#4 Minnesota St, #5 Denver, and #6 Ohio St are all playing and all vying to fill spots 4-6.

Above the bubble

Idle teams #7 Clarkson, #11 Northeastern, and #12 Providence should all stay at 13 or above.

#8 Minnesota-Duluth, #9 Minnesota, and #10 Michigan can stay top 10 with a pair of wins (though even with a pair of wins Michigan could stumble out of the top 10, most likely in the condition that they also get a loss in the best of 3 series).

On the bubble

#13 Penn State, #14 North Dakota, ad #15 Nebraska-Omaha all have the potential to climb into the single digits with a pair of wins, or fall to 16 or below with no wins on the weekend.

Of other teams, only #17 Northern Michigan and #18 Bowling Green stand a significant chance of climbing to 13 with a pair of wins.

How it works

Each forecast is based on at least one million monte carlo simulations of the games in the described period. For each simulation, the PairWise Ranking (PWR) is calculated and the results tallied. The probabilities presented in the forecasts are the share of simulations in which a particular outcome occurred.

The outcome of each game in each simulation is determined by random draw, with the probability of victory for each team set by their relative KRACH ratings. So, if the simulation set included a contest between team A with KRACH 300 and team B with KRACH 100, team A will win the game in very close to 75% of the simulations. I don’t simulate ties or home ice advantage.

Resources