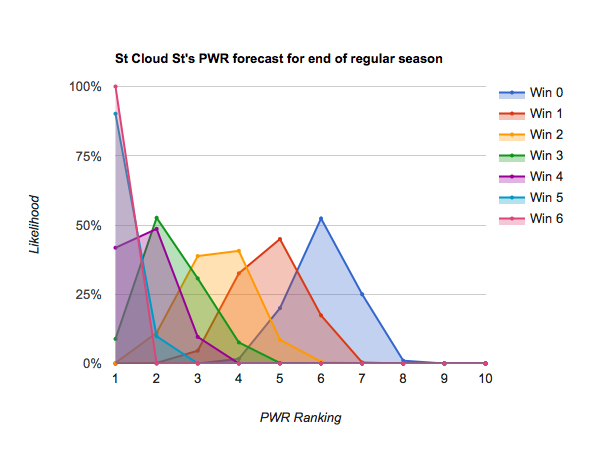
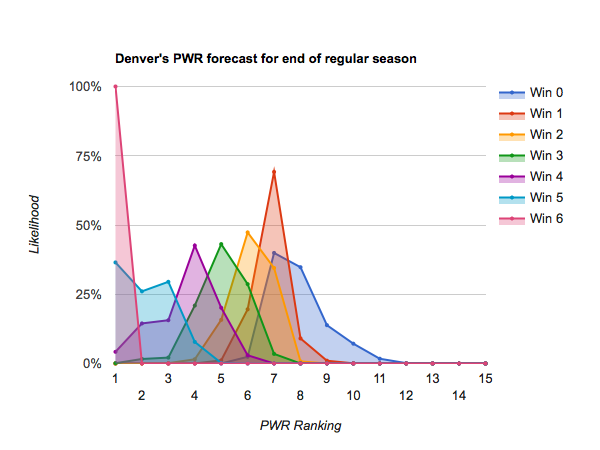
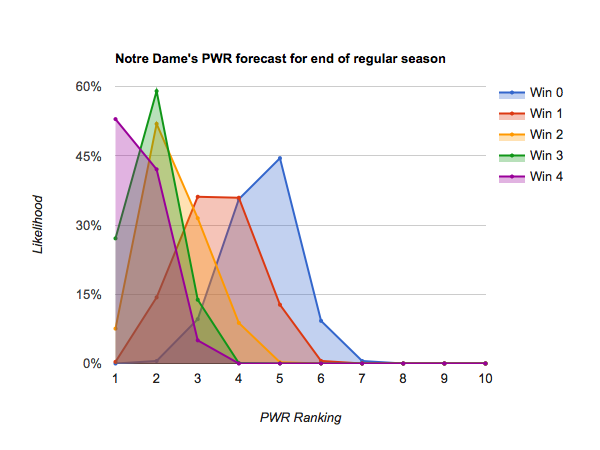
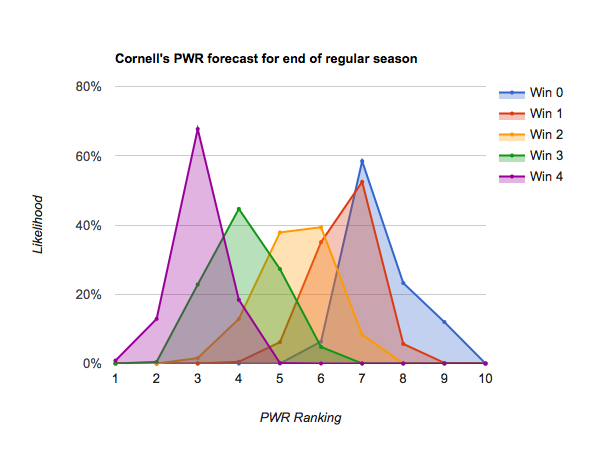
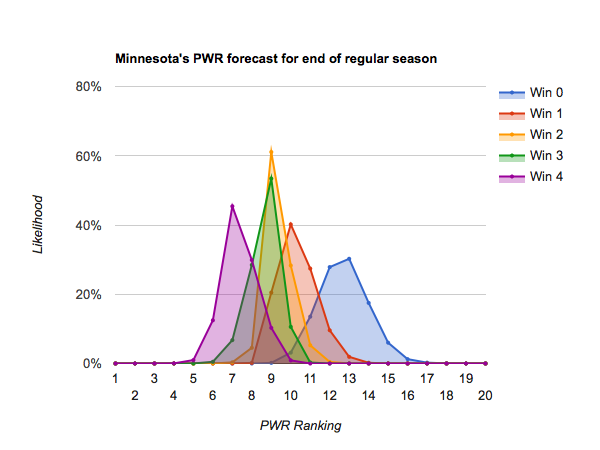
As mentioned in today’s previous article, Who’s likely to make the NCAA tournament?, most teams only have 4-6 remaining scheduled games before the playoffs, so dramatic opportunities for repositioning themselves are diminishing.
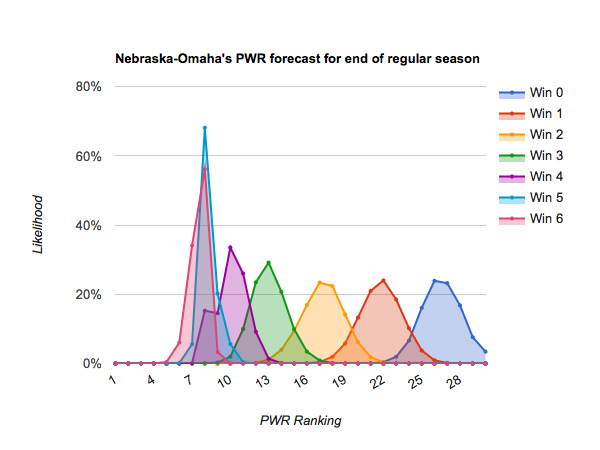
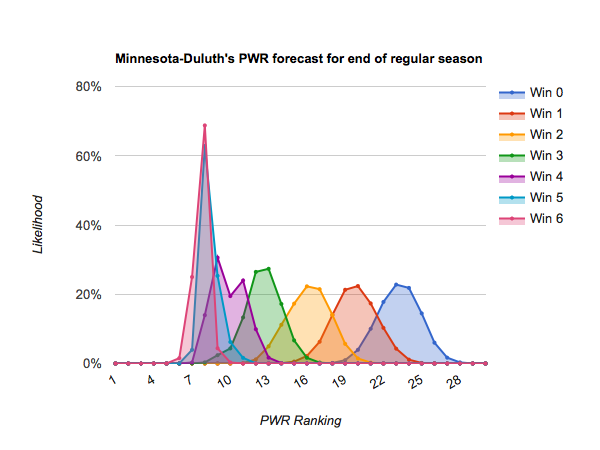
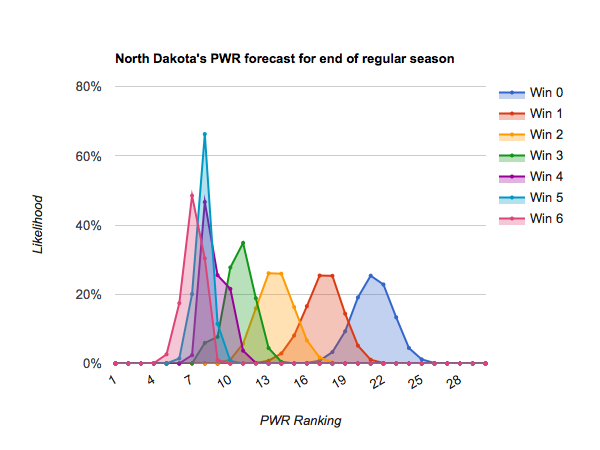
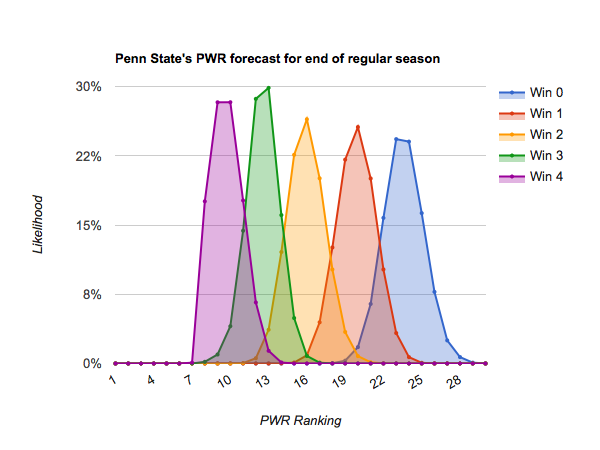
#10 Nebraska-Omaha through #17 Penn State generally stand a chance of finishing in the top 10 if they win out, or they could fall off the bubble (#16 or below) if they earn just a win or two. Those who earn a couple wins will get jostled around on the bubble by their neighbors who do particularly well or poorly. Those teams include:
#10 Nebraska-Omaha
#11 Minnesota-Duluth
#12 North Dakota
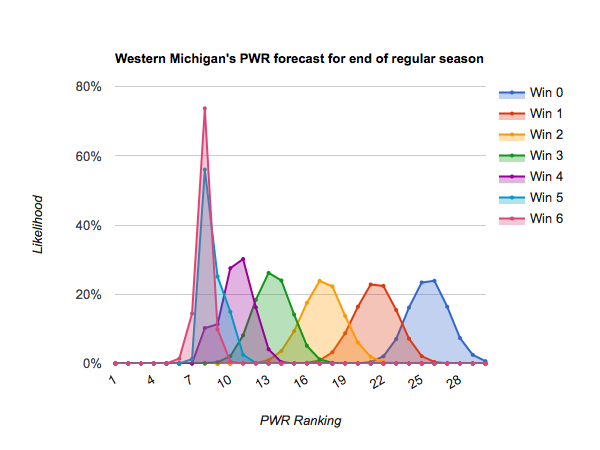
#13 Western Michigan
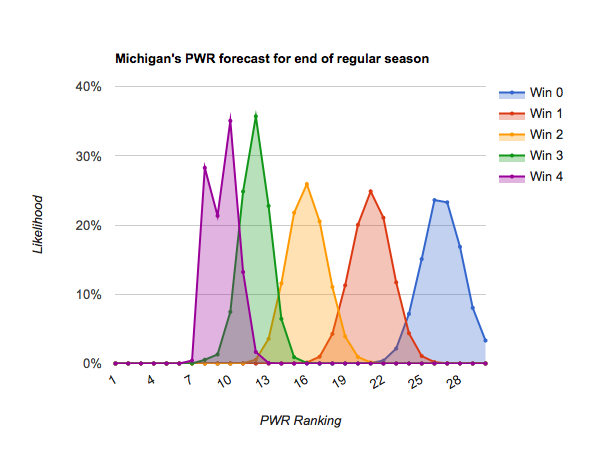
#14 Michigan
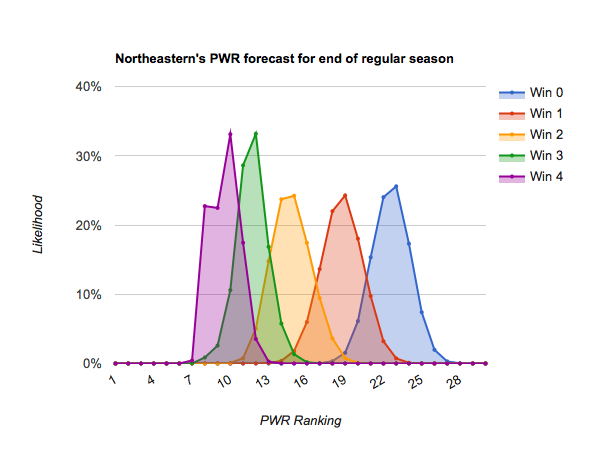
#15 Northeastern
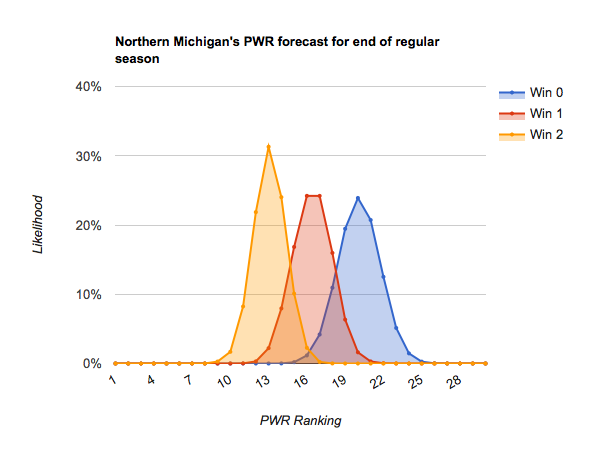
#16 Northern Michigan
#17 Penn State
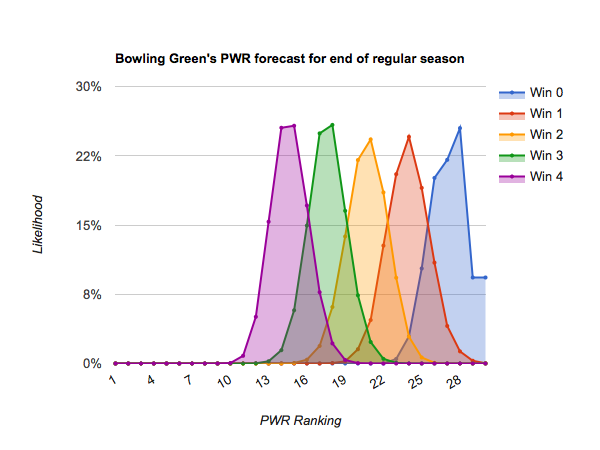
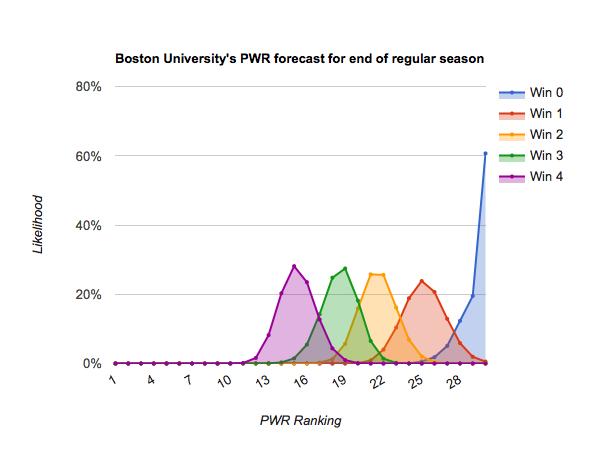
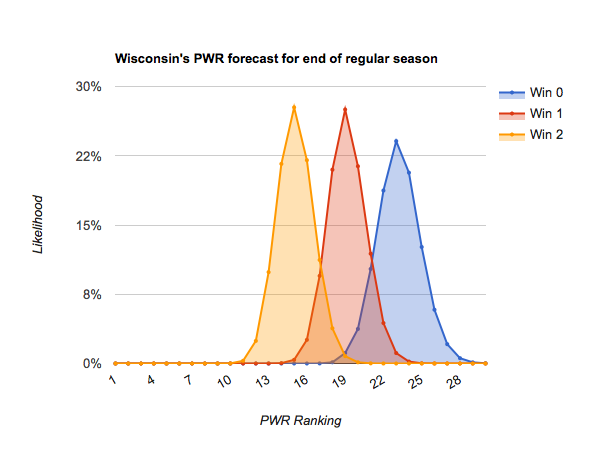
The teams just below them need to approach perfection to get into position for an at-large bid. #18 Bowling Green through #24 Maine stand a chance of breaking onto the bubble at the end of the regular season (as high as about #12) if they win out. Those teams include:
#18 Bowling Green
#19 Boston University
#20 Wisconsin
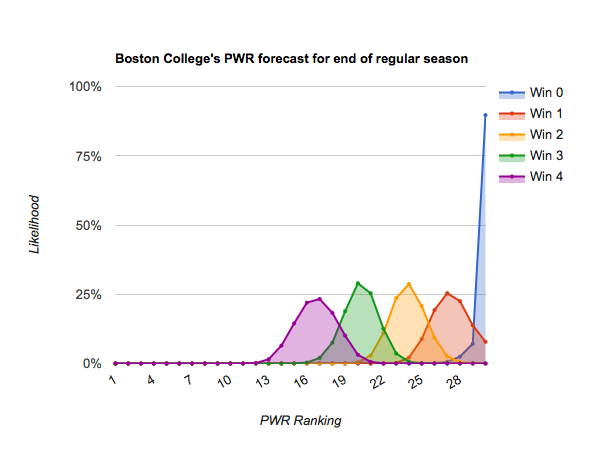
#21 Boston College
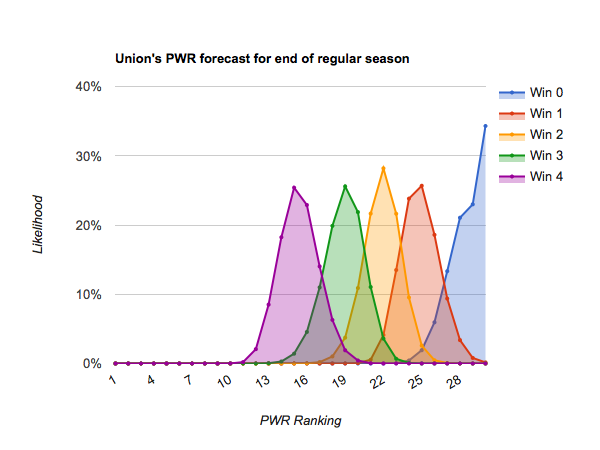
#22 Union
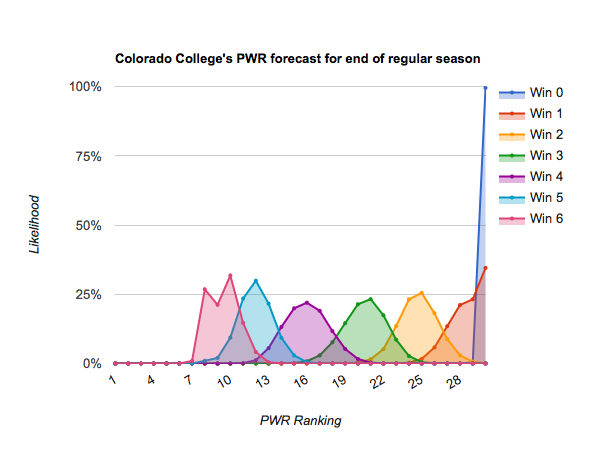
#23 Colorado College
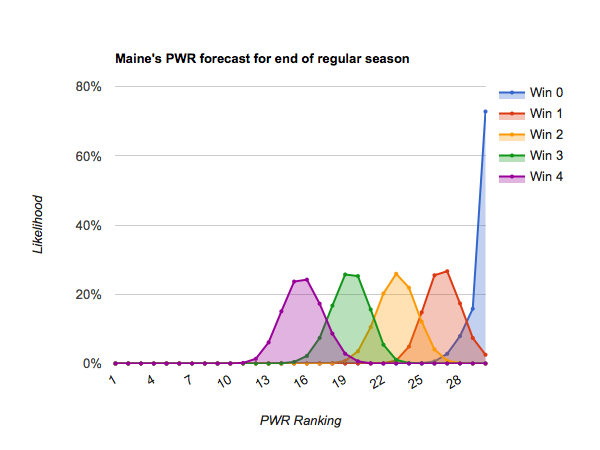
#24 Maine
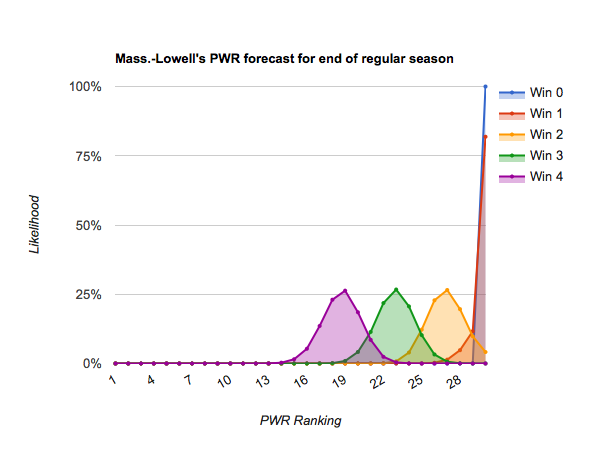
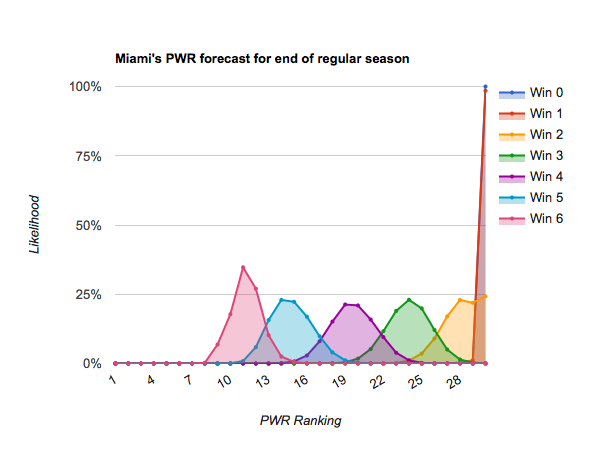
#25 Mass.-Lowell and below appear very unlikely to climb to #12 even if they win out, meaning their only likely path to an NCAA tournament bid is success in the conference tournaments. (#27 Miami has a bit more likely path than its neighbors by virtue of having six games remaining rather than 4).
How it works
Each forecast is based on at least one million monte carlo simulations of the games in the described period. For each simulation, the PairWise Ranking (PWR) is calculated and the results tallied. The probabilities presented in the forecasts are the share of simulations in which a particular outcome occurred.
The outcome of each game in each simulation is determined by random draw, with the probability of victory for each team set by their relative KRACH ratings. So, if the simulation set included a contest between team A with KRACH 300 and team B with KRACH 100, team A will win the game in very close to 75% of the simulations. I don’t simulate ties or home ice advantage.
Resources
- PWR Rankings (CollegeHockeyRanked.com)
- Forecasted PWR by team wins (CollegeHockeyRanked.com)
- CHN PWR Rankings (CollegeHockeyNews.com)
- USCHO PWR Rankings (USCHO.com)
- Explanation of how PWR mimics NCAA tournament selection (CollegeHockeyNews.com)